Demisto Add-on for Splunk
Supported versions
Available on Cortex XSOAR, Cortex XSIAM, and Cortex XPANSE.
Supporting add-on for Cortex XSOAR. This application enables you to push incidents from Splunk into Cortex XSOAR, according to configurable trigger parameters.
Source code for the add-on is available at: https://github.com/demisto/splunk-app.
Recommended Alternative: SplunkPy Pack#
For pushing Splunk events into Cortex XSOAR, we recommend using the native integrations available in the SplunkPy pack instead of this add-on.
Event Fetching Capabilities#
The SplunkPy pack integrations provide automated event fetching functionality that serves as a direct replacement for the add-on's push mechanism:
- Continuous Event Ingestion: Automatically fetch Splunk events as incidents on a configurable schedule, eliminating the need for manual alert configuration in Splunk.
- Flexible Query Configuration: Define custom SPL queries to fetch exactly the events you need, with full control over search parameters and time ranges.
- Deduplication: Built-in mechanisms to prevent duplicate incident creation, ensuring each event is processed only once.
- Field Mapping: Map Splunk event fields directly to Cortex XSOAR incident fields during the fetch process.
- Integration Health Monitoring: Monitor fetch operations through Cortex XSOAR's integration health dashboard, with clear visibility into errors, fetch statistics, and connection status.
Additionally, the SplunkPy pack provides comprehensive bi-directional capabilities for executing searches, updating events, and enriching incidents with Splunk data.
Prerequisites#
A Splunk instance, with Splunk version 8.0 or above.
Installation / Update#
- Download Demisto Add-on for Splunk from Splunkbase.
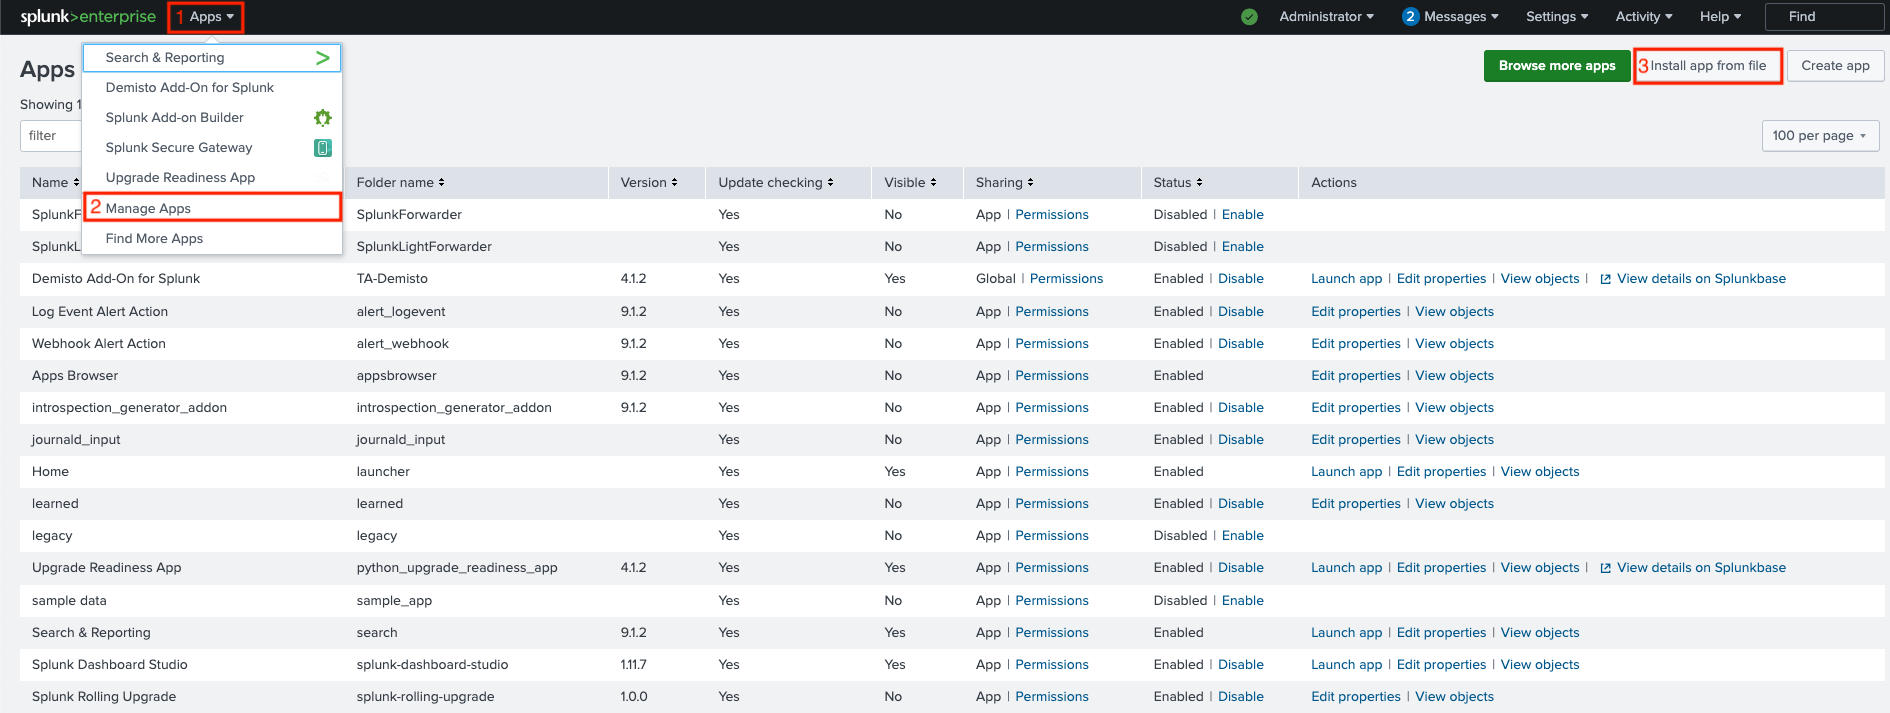
- Open your Splunk instance, Go to Apps > Manage Apps > Install app from file.
- Click Choose File and select the file that was downloaded in step 1.
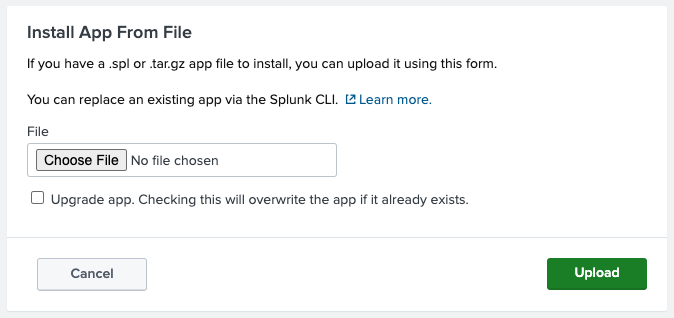
- If the add-on is already installed, and this installation is for update purposes, check the Upgrade app checkbox.
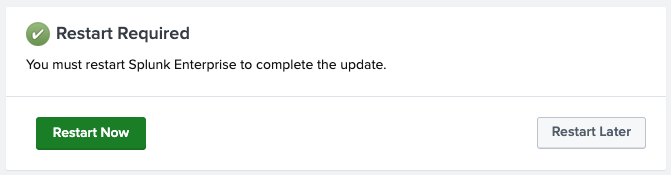
- A message saying that you need to restart Splunk will appear. Click Restart Now.
Add-on Configuration on Splunk#
Go to Apps > Manage Apps.
Find Demisto Add-On for Splunk on the list, and click Launch app on the right under the Actions column.
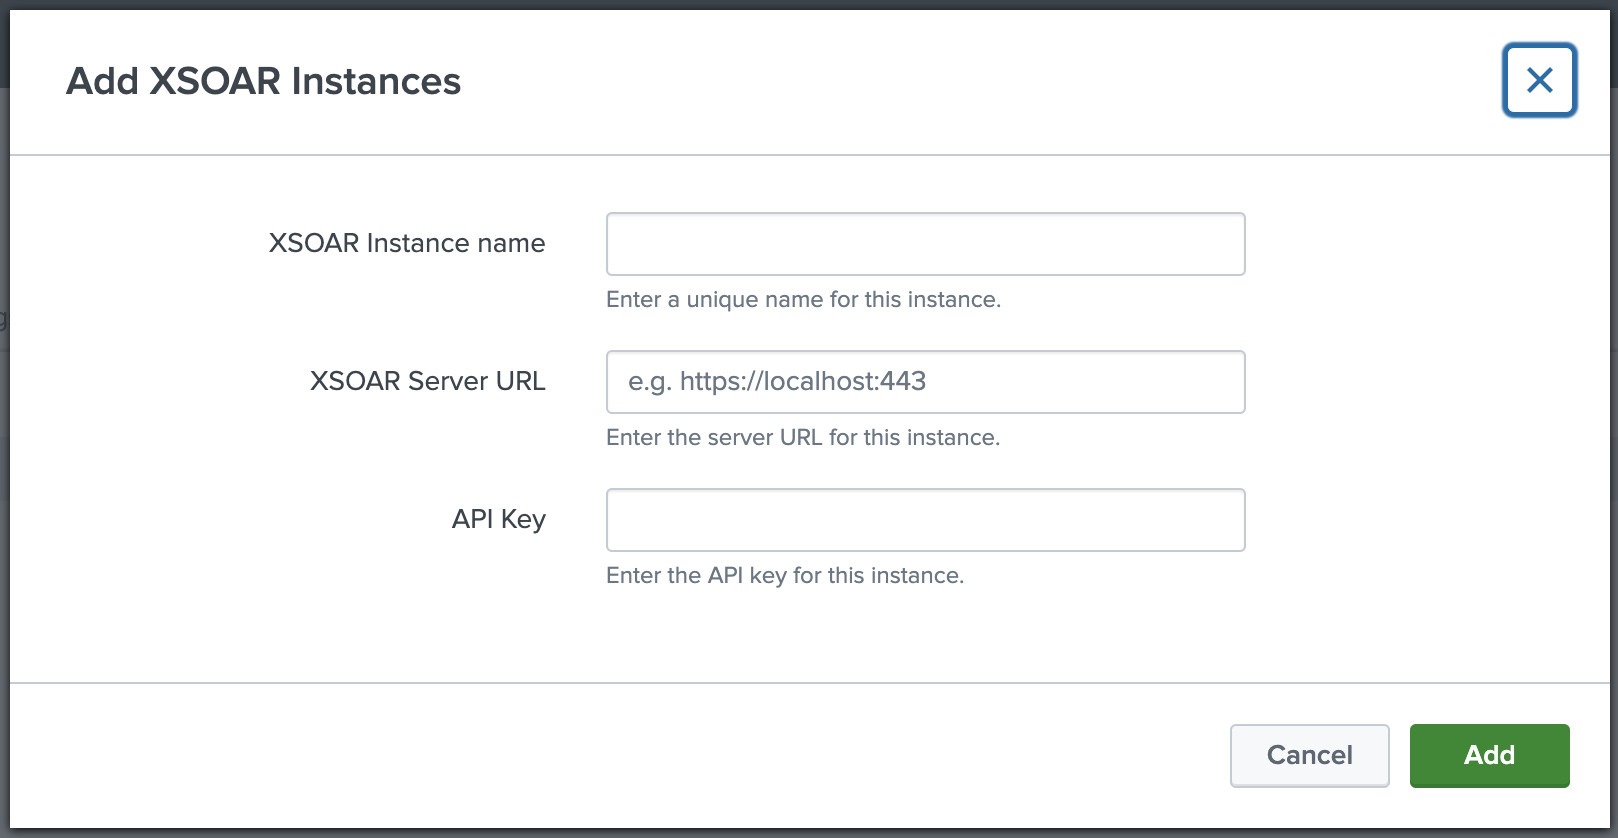
On the configuration page, click Add to add a new Cortex XSOAR instance.
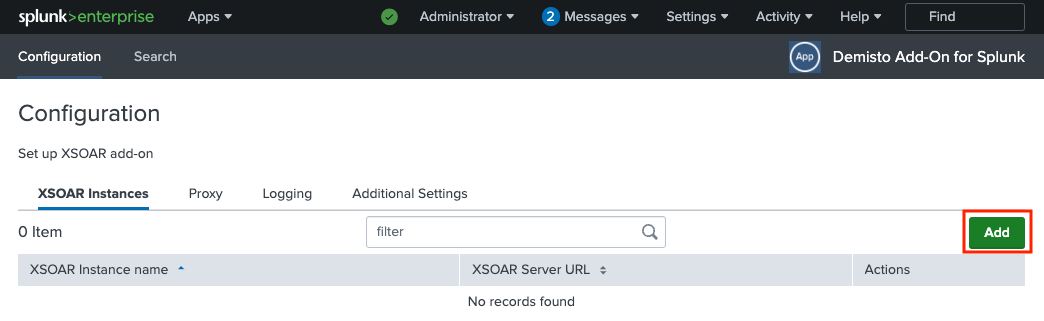
Configure a Cortex XSOAR instance:
Enter a unique instance name on the XSOAR Instance name field.
Enter your Cortex XSOAR server URL (including port if needed) on the XSOAR Server URL field.
Enter your API key on the API Key field.
- For Cortex XSOAR 6 instances:
An API key can be generated by navigating to Settings > Integrations > API Keys. - For Cortex XSOAR 8 or Cortex XSIAM instances:
An API key can be generated by navigating to Settings & Info → Settings → API Keys (under Integrations), and clicking the New Key button. Make sure to select the Advanced checkbox under Security Level.
The API key must be generated in the Advanced API Key format, and to be entered in the following format:
[API_KEY]$[API_AUTH_ID](without the brackets).
- For Cortex XSOAR 6 instances:
Click Add.
[Optional] Proxy Setup:
If you want to tunnel the traffic to the add-on through a proxy, select the Proxy tab, check the Enable checkbox, and fill all relevant proxy configuration fields.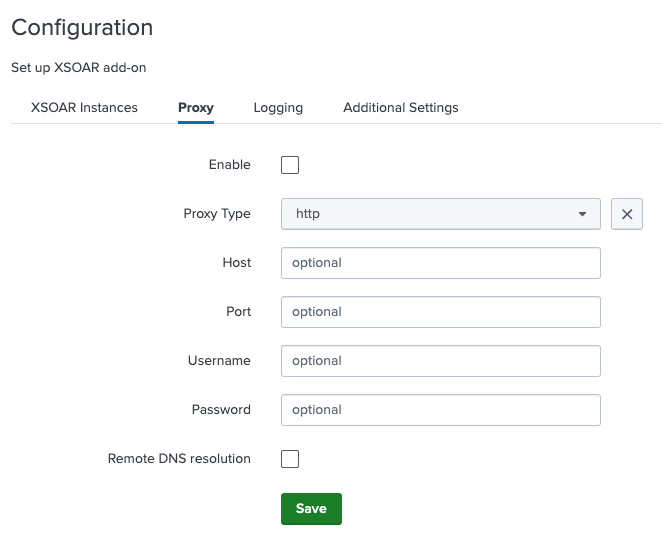
[Optional] Log Level Configuration:
By default, the logging level is "INFO". If you want to change it (we don't recommend setting it to a value that isn'tINFOorDEBUG), select the Logging tab, and choose the desired logging level from the Log Level drop-down list.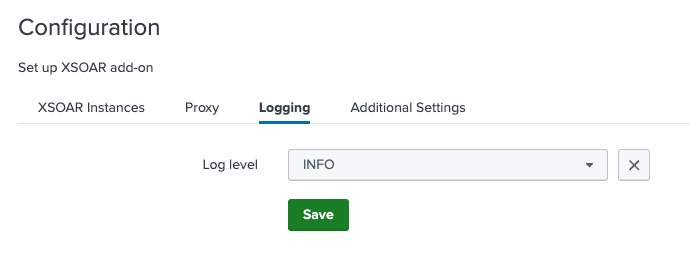
[Optional] SSL Certificate Configuration:
If you have an internal / self-signed SSL certificate, select the Additional Settings tab, and provide its full path in the Location to Certificate field.
Certificate validation is enabled by default. If you don't want to validate the SSL certificate, uncheck the Validate SSL checkbox (NOTE: This option will not work for Splunk Cloud).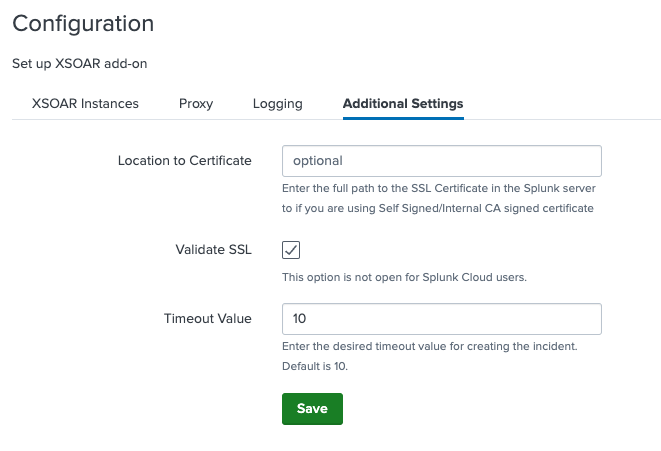
[Optional] Timeout configuration: If you would like to extend the incident creation request timeout time, select the Additional Settings tab, and enter the desired timeout value in the Timeout Value field.
By default, timeout value is 10 seconds.After all configurations are set, restart Splunk to apply the changes.
To restart Splunk, go to Settings > Server Controls, and click Restart Splunk.
Alert Configuration#
In order for an alert to be pushed as an incident to Cortex XSOAR, you must add Create XSOAR Incident as a trigger action for the alert on Splunk.
After adding the trigger action, you can configure the action to determine how the incident will be created in Cortex XSOAR.
The following fields are available for configuration:
| Field | Description |
|---|---|
| Name | Name of the alert. |
| Time Occurred (epoch) | Time when the alert was triggered. |
| Send Alert to all the Servers | If enabled, the alert will be pushed to all configured Cortex XSOAR servers configured. |
| XSOAR Server | Cortex XSOAR server to which the incident will be pushed (needed only if Send Alert to all the Servers is unchecked). Note: For Cortex XSOAR 8, the XSOAR Server URL must be prefixed with api-. |
| Type | Incident type in Cortex XSOAR. |
| Custom Fields | A comma-separated, 'key:value' formatted, custom fields pairs. |
| Labels | A comma-separated list of values to set for the labels field in the incident on Cortex XSOAR. |
| Severity | The severity to set for the incident on Cortex XSOAR. |
| Details | The details field value to set for the incident on Cortex XSOAR. |
Configuration Test#
To assure the add-on is properly configured, and that incidents are being created in Cortex XSOAR properly, follow the steps below:
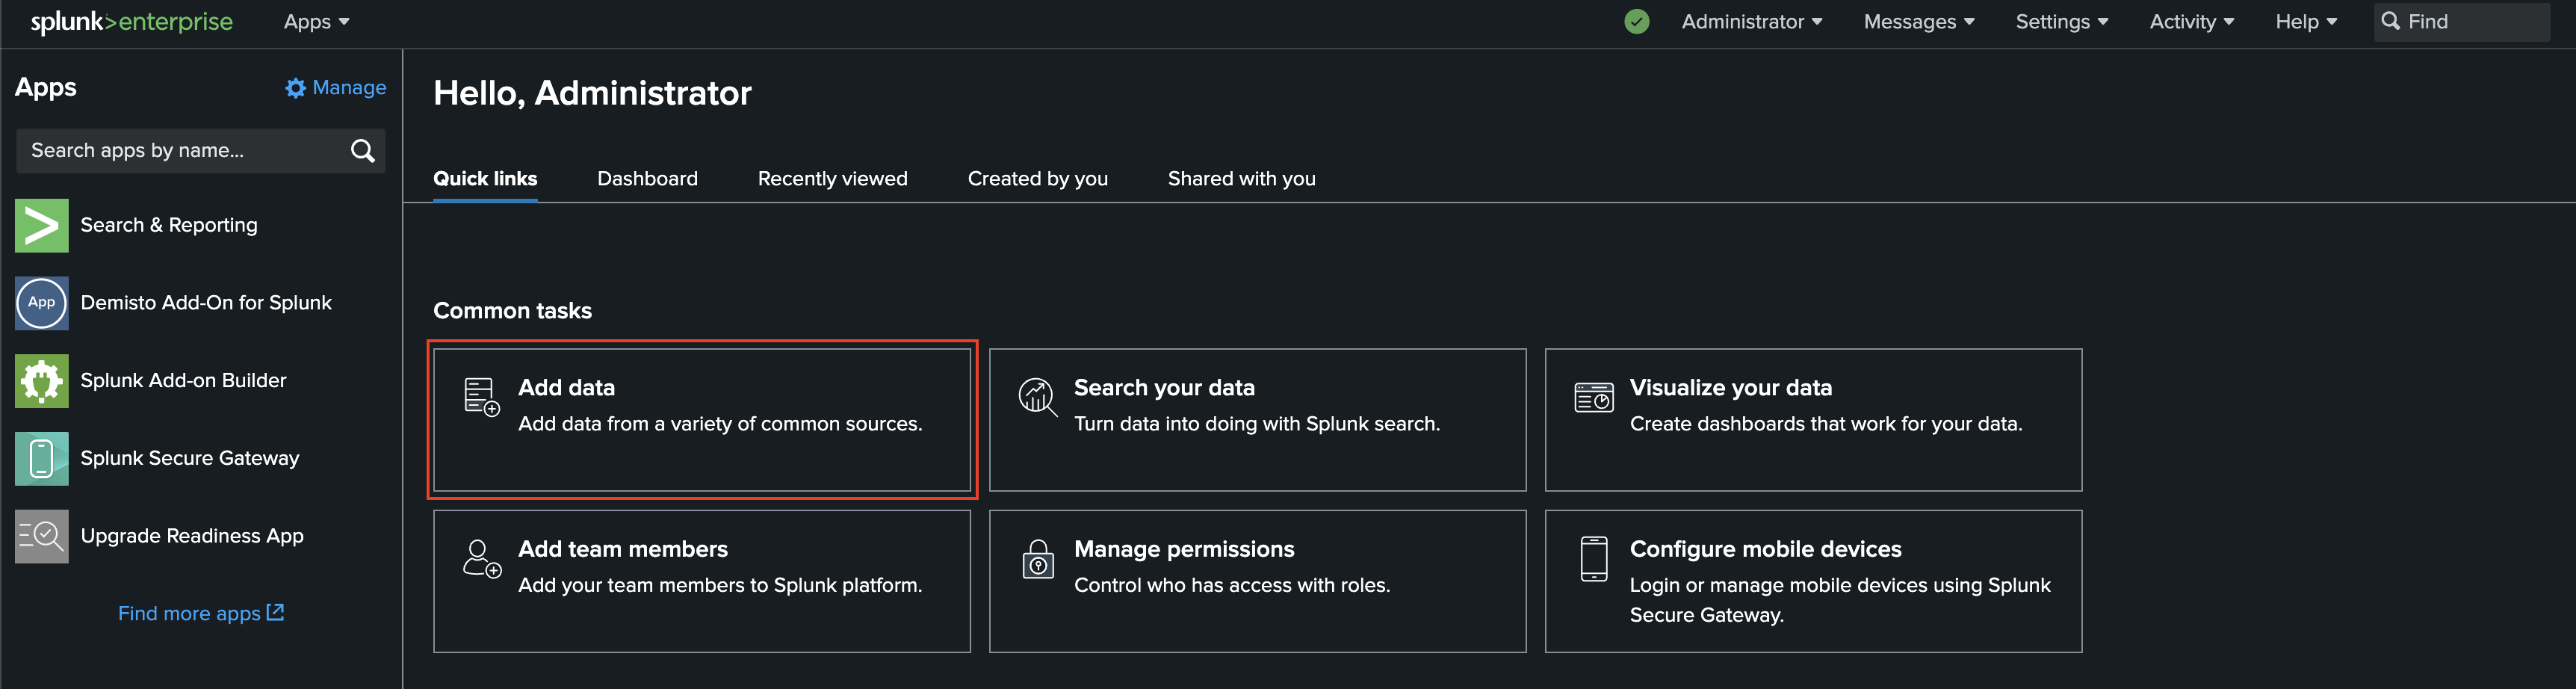
- Click Add Data on the front page of Splunk.
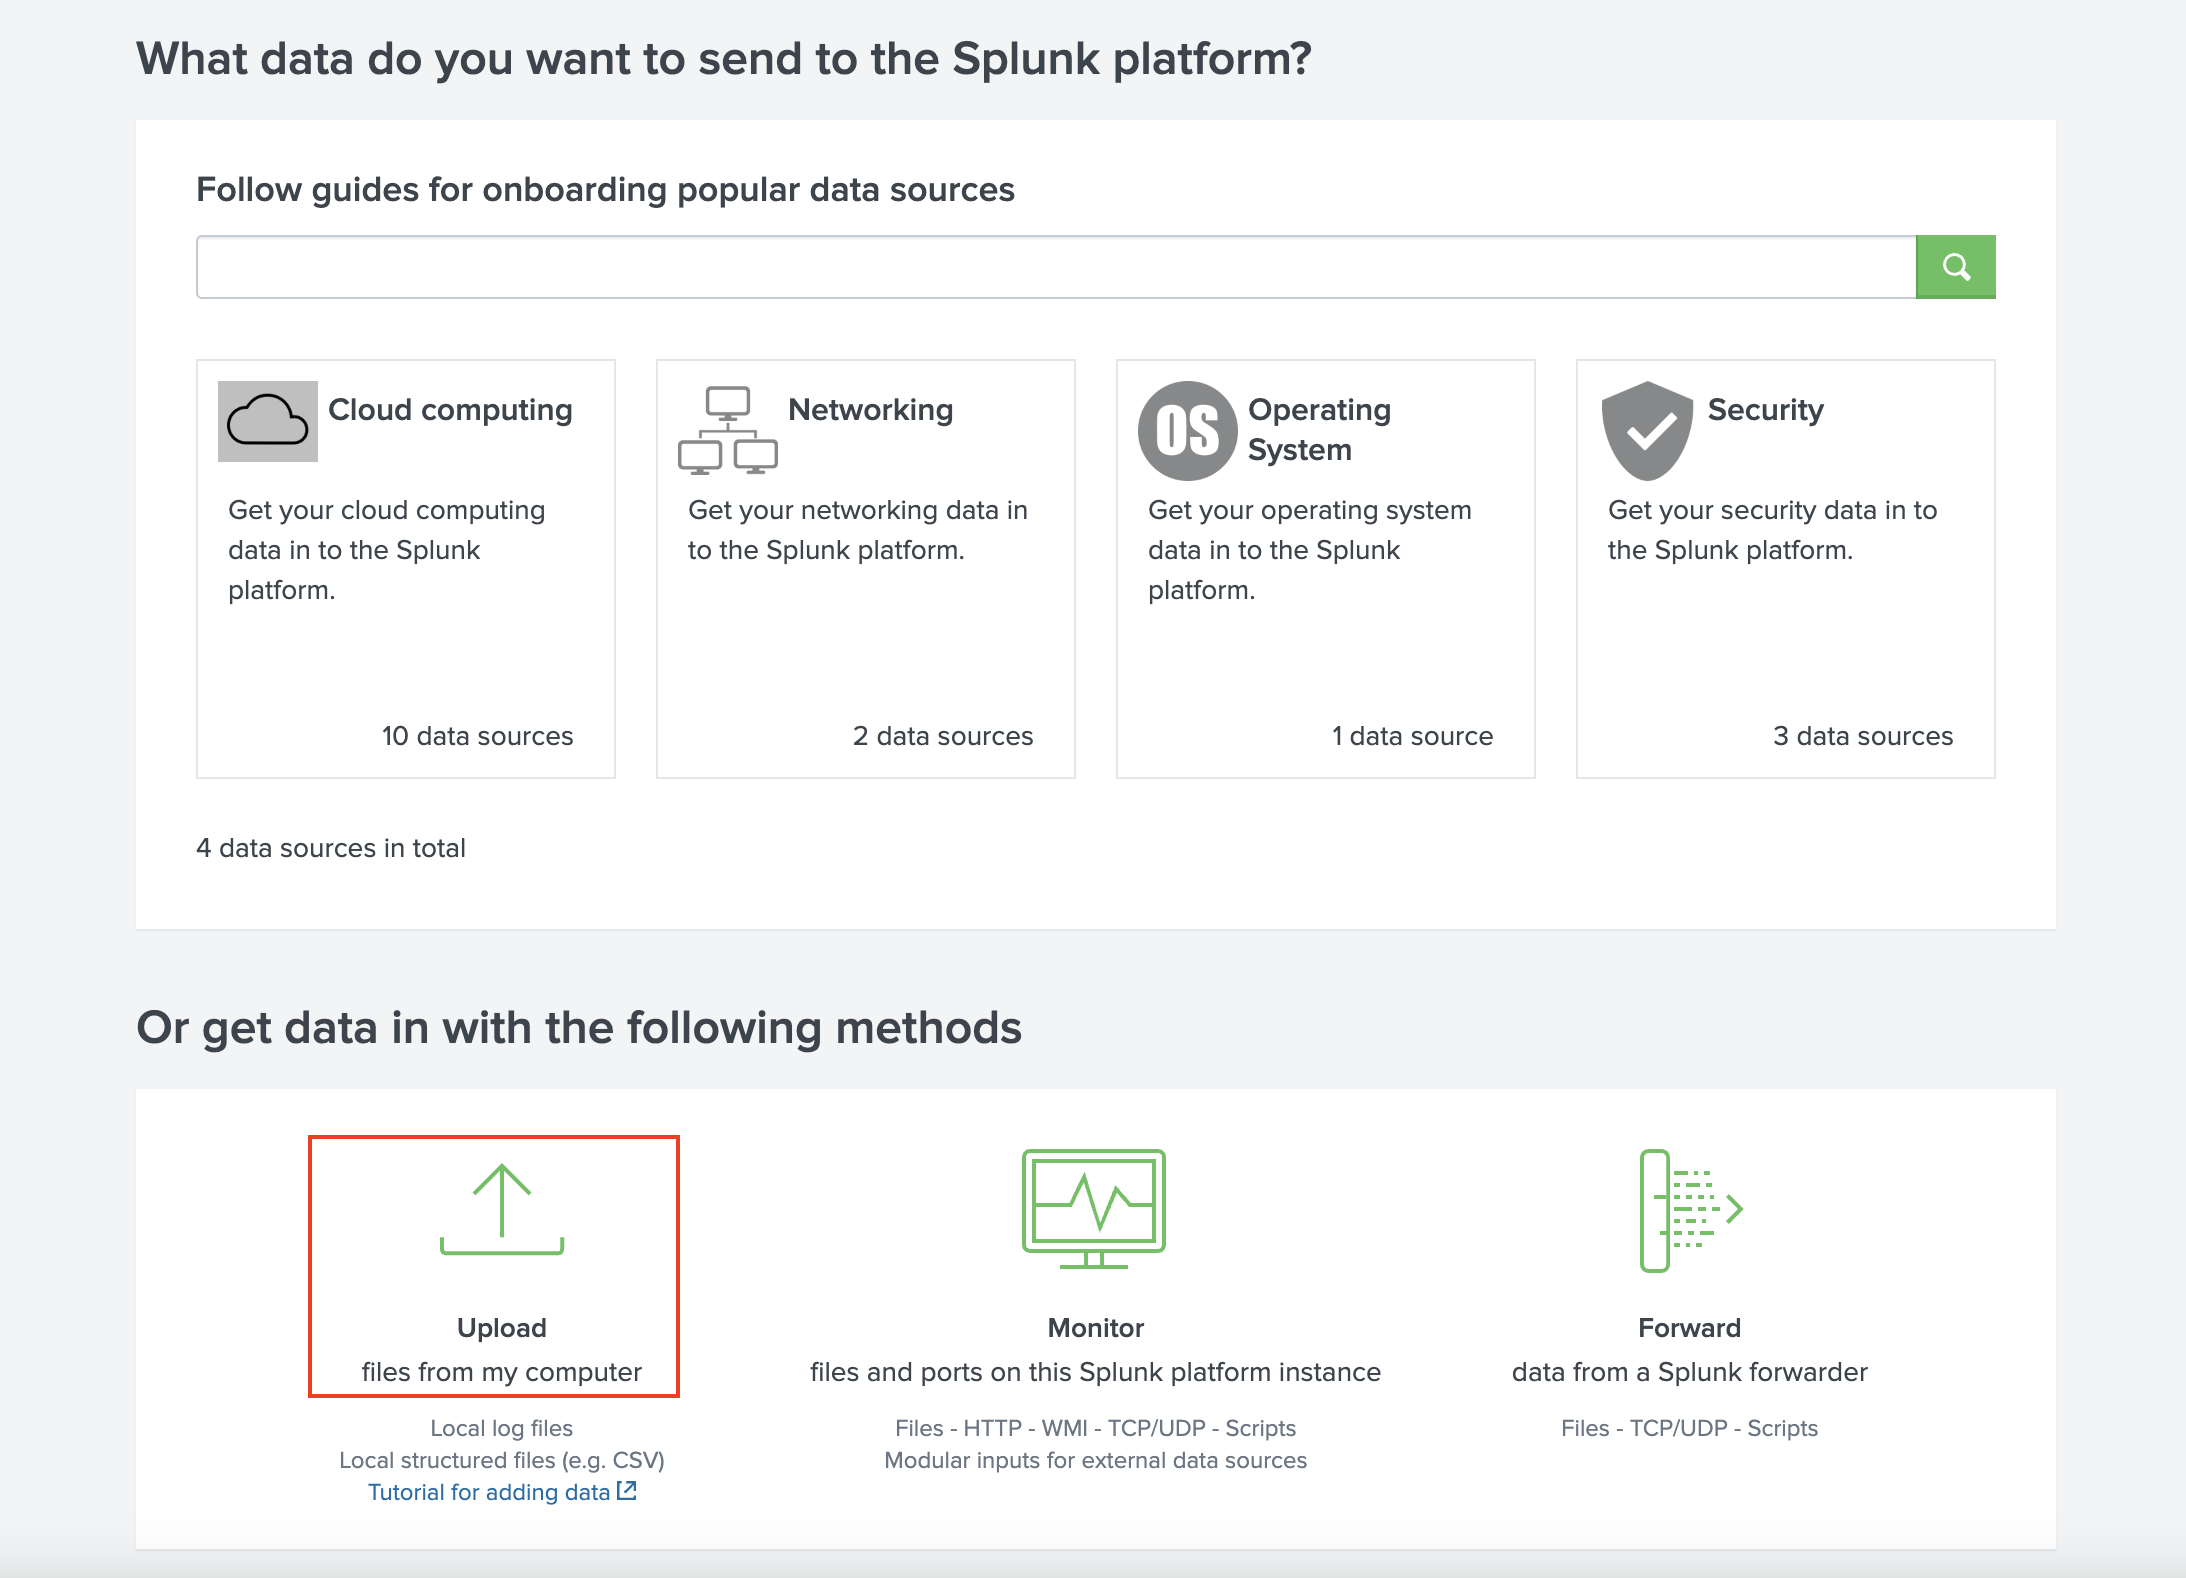
- Click Upload.
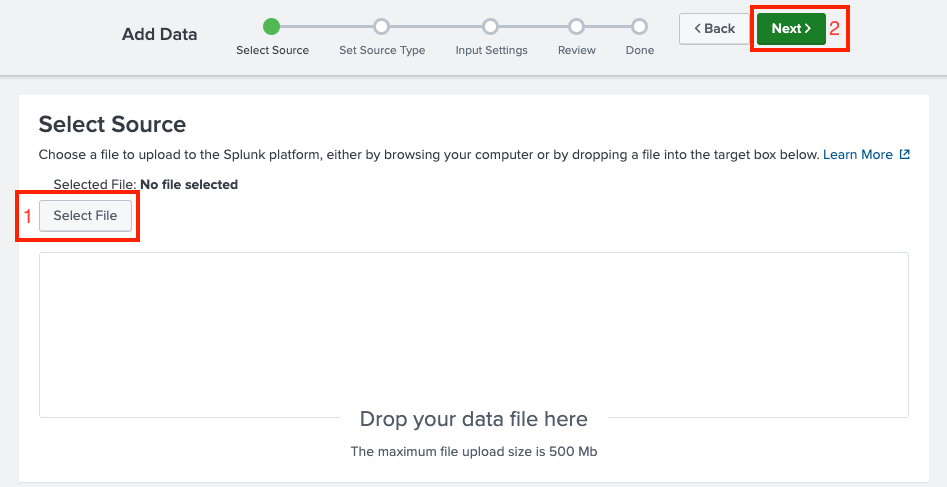
- Click Select File, select a random file (preferably a small text-based file), and click Next.
- Click Review at the top, and then Submit.
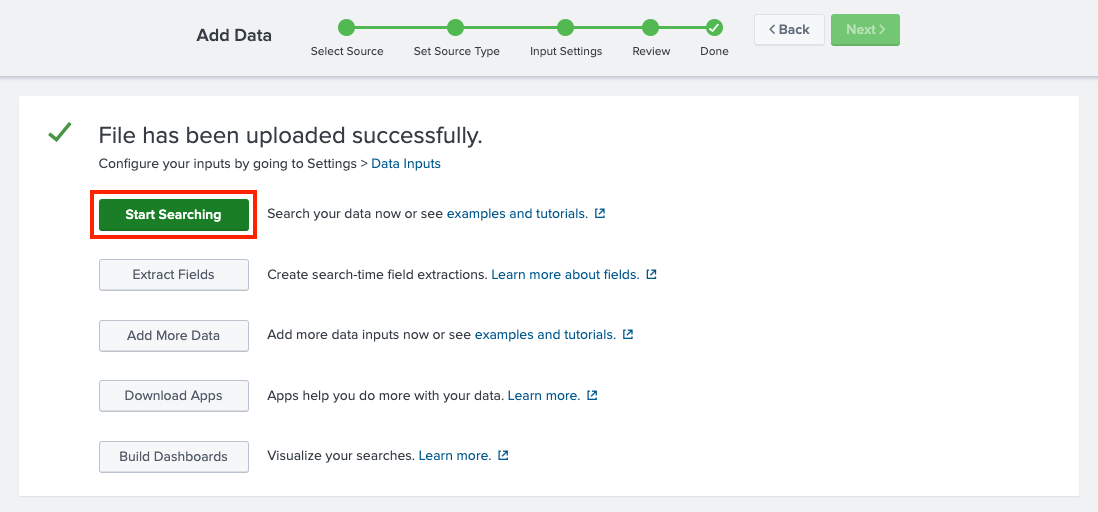
- After that, you should see a message saying "File has been uploaded successfully."
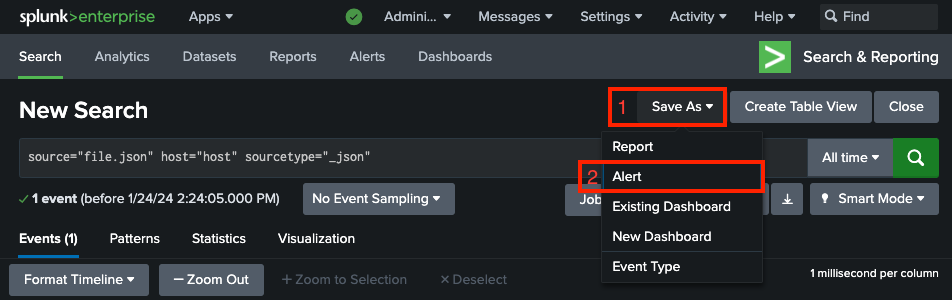
Click Start Searching.
- A "New Search" page will open. Click Save As, and then Alert.
- Configure the alert:
- Title - Some value.
- Permissions – Shared in App.
- Alert type – Scheduled, and then Run on Cron Schedule.
- Cron Expression – * * * * * (5 asterisks, indicates a schedule of every 1 minute).
- Under Trigger Actions, click Add Actions, and then select Create XSOAR Incident.
- Configure the Create XSOAR Incident action as described in the Alert Configuration section.
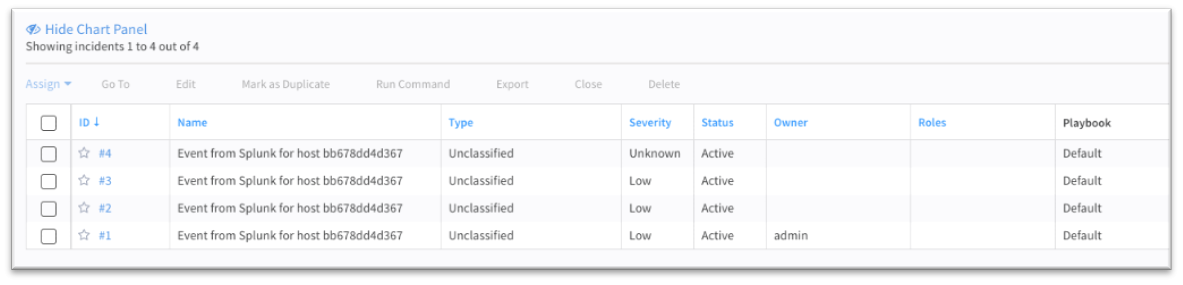
- Enter your Cortex XSOAR server, wait a few minutes for incidents to be ingested, and ensure that incidents are being created in Cortex XSOAR properly.
tip
A list of saved Alerts can be found by navigating to Apps > Search & Reporting > Alerts.
Appendix#
Local Splunk Environment Setup#
To set up a local environment for testing purposes, run the following command to start a Docker container of Splunk (replace ***** with any 8-character password, containing letters and digits):
Once the container is up and running, the Splunk environment will be accessible on http://localhost:8000.
For more information about the Splunk Docker image and containers configuration, see the official Splunk DockerHub Page.
Create an Adaptive Response Action for Splunk Enterprise Security#
- Click Incident Review. For Splunk Enterprise Security users, all incidents are reported in the Incident Review Dashboard.
- Click the Actions drop-down list for the incident that you want to be created on Cortex XSOAR.
- Click Run Adaptive Response Actions.
- Click Add New Response Action.
- Select Create XSOAR Incident from the list of actions.
- Fill in the details that need to be sent out to Cortex XSOAR (as described in the Connectivity Test. When finished, click Run.
- Splunk will display a message indicating that the action has been dispatched.
- Back in the main screen of the Incident List table, Click the I button to list incidents in detail and track actions that took place when the incident occurred in Splunk.
- Check the Adaptive Response section under details. It should include a response like XSOAR Custom Alert Action with a status.
- Click XSOAR Custom Alert Action to drill down to more details on the alert action that was called along with the detailed response received from Cortex XSOAR.
Troubleshooting#
Logs#
Relevant logs for troubleshooting and debugging can be found in the following paths:
- Add-on logs:
var/log/splunk/create_xsoar_incident_modalert.log - Splunk logs:
var/log/splunk/splunkd.log
Common Issues#
Splunk Events are not Created in Cortex XSOAR#
If after associating Create XSOAR Incident with saved searches, correlation searches using automated invocation, or using ad-hoc invocation from Splunk Enterprise Security's incident review dashboard, incidents are not being created on Cortex XSOAR, the following should be checked:
Check the configuration page. You may need to restart the add-on in order for the modifications to take effect.
Check the Saved Search trigger conditions. Splunk might be suppressing the events, which causes it not to create an incident in Cortex XSOAR.
Test the network connectivity in-between applications to ensure there are no connectivity issues. You can use the following commands to test the connectivity:
Test the API key generated in Cortex XSOAR.
Connection Timeout Errors#
Connection timeout errors can be identified in the Splunk logs, and will appear as follows:
In case of a connection timeout error:
- Locate the
SavedSplunkerlog facility. - Increase its verbosity to ERROR level.
- If the logs include the following: Increase the max_per_result_alerts_time value in the
limits.conffile.
Incidents Created in Cortex XSOAR with Incorrect Fields#
If incidents are being created in Cortex XSOAR with incorrect fields, ensure that the Create XSOAR Incident trigger action for the alert is configured properly. For more information about the fields mapping, see the Alert Configuration section a
Too Many Incidents Are Created in Cortex XSOAR#
Splunk has its own trigger conditions using the number of incidents which get pushed to XSOAR controlled.
See Splunk's Configure alert trigger conditions documentation to understand Splunk Trigger Conditions to limit the incidents.
It is also possible to throttle alerts in Splunk after the saved search returned positive results, in order to suppress more incident creation.
Playbooks not getting invoked on Cortex XSOAR#
Cortex XSOAR allows users to set up different types of incidents, and the user can associate different playbooks for each type of incident. If after pushing incidents from Splunk, the appropriate playbooks are not being invoked, you should check the following:
- Check if the type of incident which is getting pushed from Splunk has a playbook associated with the type in Cortex XSOAR.
- Check if there are no case differences in the type created in Cortex XSOAR and the type which is being pushed along with incident information in Splunk.
SSL Certificates Issues#
- If you don’t use a certificate, make sure the Validate SSL checkbox is not selected.
- If you have a self-signed certificate, you must add it to the Splunk server first, and then set the path to it in the Add-on configuration page.
- In the case of a self-signed certificate, make sure that the whole certificate chain exist. Each of root, intermediate, and client certificate is required.
- When checking SSL certificate validity by pinging, ping to the server domain. SSL certificates are signed on server domain rather than its IP.
Splunk Common Information Model (CIM) Issues#
If Splunk CIM is installed, make sure its version is compatible with the installed Splunk version. A common error caused by a version incompatibility might look as the following: