The Default Pack
Supported versions
Available on Cortex XSOAR, Cortex XSIAM, and Cortex XPANSE.
Introduction#
The Default pack provides a solution for new users who are still early in their Cortex XSOAR journey, or as a solution for use cases that you would like to handle but are yet to create content for.
We’ve created a playbook that puts together the core elements of handling any kind of incident. With this playbook there’s also a new layout that gives insight into the data that came with the incident together with any new information collected during the investigation of that incident.
Walkthrough#
Playbook#
The playbook makes use of existing out-of-the-box, free content in order to investigate the incident.
It has one input - whether to extract and enrich indicators from the fetched incident (turn on in case you decided to disable auto-extract).
Extracting and enriching the indicators related to the incident is crucial for the investigation and response process. If you are unsure, we suggest to keep the input value as "True".
The playbook begins by de-duplicating any similar incidents. If a file is involved in the incident, it will then run the following steps:
- Attempt to retrieve the actual file by its hash or file path
- Search for endpoints that have that file on them and display them in the layout
- Extract indicators from the file
- Detonate the file
Regardless of whether a file is involved or not, the playbook will continue with the next steps:
Detonate URLs if a supported sandbox integration is enabled.
Enrich the indicators using the Entity Enrichment - Generic v3 playbook, which can verify SSL certificates, take screenshots of URLs, check for domain-squatting, and more.
Calculate a severity for the incident based on various factors.
If the incident is deemed a true positive, the playbook allows the user to remediate the incident automatically and/or manually.
Finally, the playbook generates an investigation report and closes the incident.
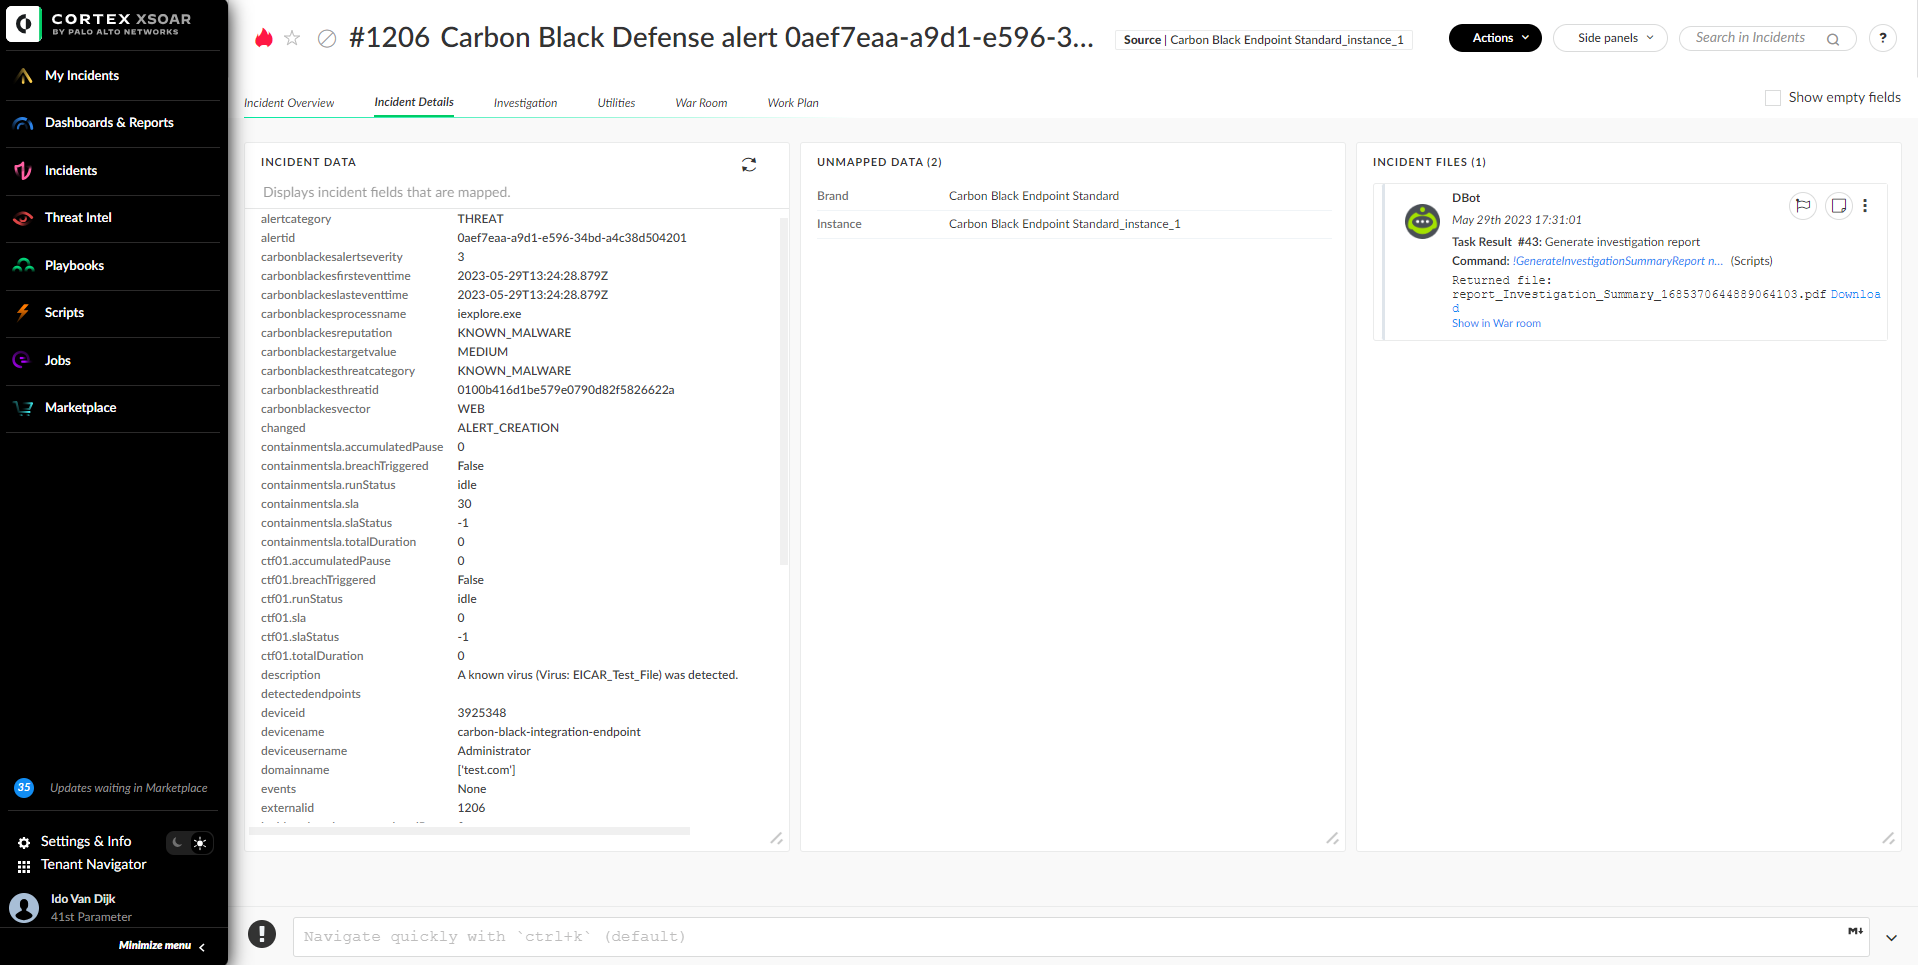
Layout#

The layout is built in a way that would fit any type of incident by using a dynamic section that dynamically loads the fields you’ve mapped for that incident type.
If you haven’t mapped any fields, you will see them in the “Unmapped Fields” section.
Additionally, the layout provides buttons for the user to tag indicators as benign or malicious for later use in an EDL. For example, you may want to tag malicious indicators as "mal", or benign indicators as "safe". The Default layout allows you to make use of these tags by using the buttons that correspond to the indicators you want to tag. Note: Tagging the indicators does not automatically allow or block them. Instead, tagging indicators can be used in conjunction with an External Dynamic List and the Generic Export Indicators Service integration. You can read more about it by installing the pack from Marketplace and reading the integration documentation.
The layout also provides buttons for checking whether an IP is private or public, and whether a domain is internal or external. These buttons make use of new scripts that utilize Cortex XSOAR Lists for centralized management of that data.
Note: The aforementioned lists should be modified by the user to function correctly. The InternalDomains list should include the internal domains and/or subdomains of the organization, and the PrivateIPs should include any IP addresses or IP ranges in CIDR notation that are considered as private in the organization, along with optional tags. If needed, the user can create new lists and use them with the scripts instead.
The Default layout aims to make it as easy as possible for an analyst to investigate an incident. This is why it makes use of dynamic sections (sections that update dynamically by running scripts behind the scenes) and buttons.
The "Investigation" tab displays related assets and indicators from the incident. If mapped, information like "Source IP" or "Detected Endpoints" will show up in that tab, along with the available buttons. In addition, any indicator found throughout the incident will show up in the Indicators section, and could be selected and tagged for allowing or blocking using an EDL.

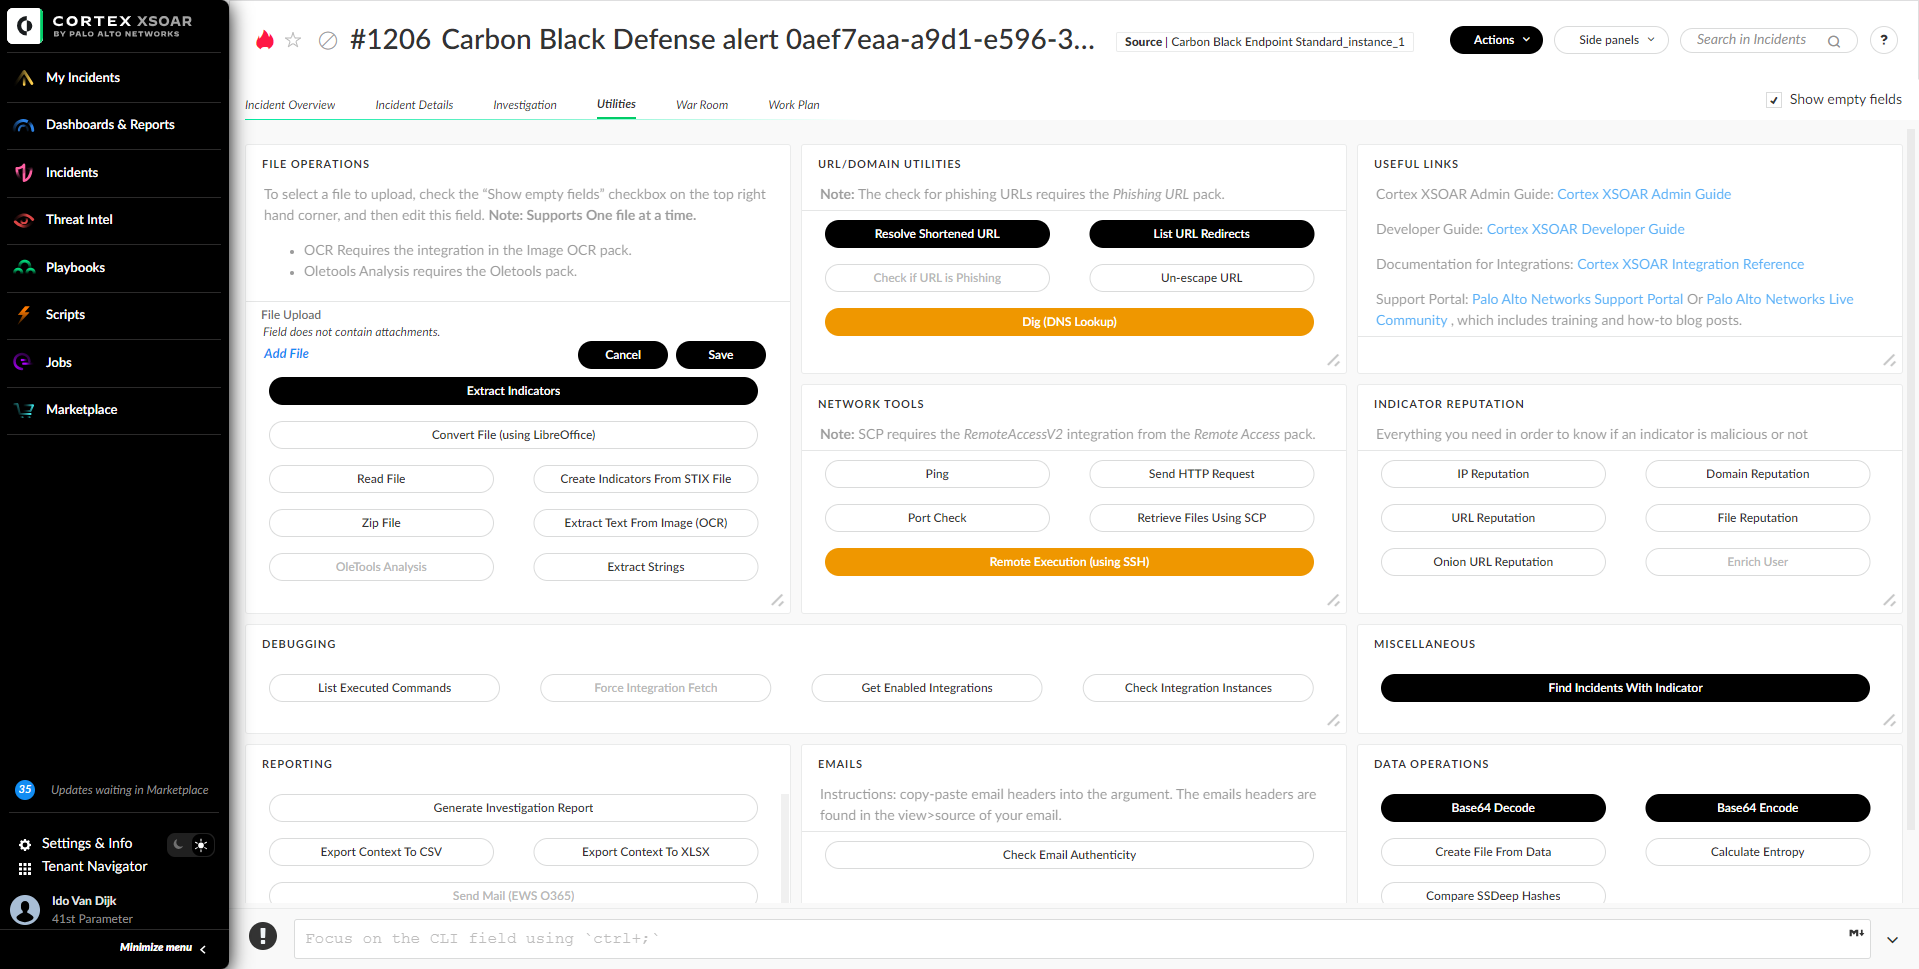
The “Utilities” tab provides a collection of the most common scripts an analyst may use - from data manipulation scripts and networking tools to Cortex XSOAR debugging utilities. As explained in the different sections, some buttons require scripts from complimentary packs which are free to install from Marketplace. This tab may be useful if the analyst needs to base64 decode a string, list the redirects for a given URL, ping a host on the network, etc.
How To Use#
In order to make use of the Default layout, do the following:
- Go to Settings & Info > Settings.
- Under Object Setup, click Incidents
- Under the Types tab, select the incident type you would like to use with the Default layout. If the incident is locked, you first need to duplicate it or detach using the appropriate buttons.
- Under Layout, select the Default layout.
- To use the Default playbook for your incident type - under Default playbook - select the Default playbook.
