XQLDSHelper
This Script is part of the XQLDSHelper Pack.#
Supported versions
Available on Cortex XSOAR (versions 6.0.0 and later) and Cortex XSIAM.
Run an XQL query and creates an entry for the General Purpose Dynamic Section to display a graph or table widget based on the results.
The query is executed by the xdr-xql-generic-query and the xdr-xql-get-query-results command.
Script Data#
| Name | Description |
|---|---|
| Script Type | python3 |
| Tags | Utility |
Inputs#
| Argument Name | Description |
|---|---|
| templates_type | The type of the templates data. |
| template_name | The name of a template to choose it from 'templates'. |
| templates | A list of templates to choose from for building an entry. |
| base_time | The base time for the relative time provided to earliest_time or latest_time (The default is the first available value from the following: issue.occurred, alert.occurred, incident.occurred, issue.created, alert.created, incident.created, now). |
| round_time | The value (in seconds) used to round down the base time (Default = 0). If two parameters are provided in a list, they will be applied to the base time for earliest_time and latest_time, respectively. |
| earliest_time | The earliest time at which the time range of the query starts (Default = 24 hours ago). |
| latest_time | The latest time at which the time range of the query ends (Default = now). |
| variable_substitution | The pair of default opening and closing markers that enclose a variable name (Default = ${,}). |
| triple_quotes_to_string | Set to true to convert a string within triple quotes in the templates to a JSON string if it is of type string. Set to false to use the templates as they are, without any conversion. Both triple single quotes, triple double quotes and triple backquotes are supported. (Default = true) |
| cache_type | The name of the type that defines which data is stored and retrieved from the cache to create the entry (Default = recordset). |
| max_retries | The maximum number of retries to query XQL for recoverable errors (Default = 10). |
| retry_interval | The wait time (in seconds) between retries (Default = 10). |
| polling_interval | The polling interval (in seconds) to wait for results (Default = 10). |
| query_timeout_duration | The maximum duration (in seconds) allowed for an XQL query to complete after it has started (Default = 60). |
| context_data | The custom context data is merged with the current context data for use. |
| output_recordset | Set to true to return the recordset in the outputs context; otherwise, set to false. |
| xql_query_instance | The name of the integration instance to execute xdr-xql-generic-query and xdr-xql-get-query-results. |
Query Execution Timeout and Retry Limits#
Due to limitations on the number of XQL queries that can run in parallel, the script will poll at intervals of retry_interval seconds until the query becomes available to execute, with a maximum of max_retries attempts.
Once the query starts running, it may take some time to return results. During this period, the script will continue polling at intervals of polling_interval seconds while waiting for the results. If the results are not returned within the query_timeout_duration seconds, the query will be treated as an error.
Outputs#
| Path | Description | Type |
|---|---|---|
| XQLDSHelper.QueryParams | The query parameters. | unknown |
| XQLDSHelper.QueryHash | The hash value of the query parameters. | string |
| XQLDSHelper.RequestURL | The URL path, including query parameters, used to search datasets in the XQL builder. | string |
| XQLDSHelper.ResultURL | The URL path used to get the results of an executed query in the XQL builder. | string |
| XQLDSHelper.ExecutionID | The unique execution ID for the request query. | string |
| XQLDSHelper.RecordSet | The record set retrieved by the XQL query. | unknown |
| XQLDSHelper.Entry | The entry data for the general dynamic section. | unknown |
Structure of the templates#
The data provided to templates depends on the parameter specified in templates_type.
templates_type:
raw- Specifies the list of templates directly. The details will be provided later.
templates_type:
base64- Specifies the list of templates encoded directly in base64. The details will be provided later.
templates_type:
list- Specifies the name of a list managed in the
Listsof Cortex XSIAM/XSOAR. The list of templates is retrieved from it.
- Specifies the name of a list managed in the
The list of templates must be either a dictionary or a serialized JSON string. It can contain multiple templates, and a summary of the structure is provided below.
A template must be a dictionary node with two mandatory dictionary nodes (query and entry) and an optional dictionary node (config).
The summary of the template structure in the templates is provided below.
Node: config#
| Path | Description | Type |
|---|---|---|
| .config.variable_substitution.opening | [Optional] The opening marker of the enclosure for variable substitution. It overrides the opening marker specified in the variable_substitution parameter of the arguments. | String |
| .config.variable_substitution.closing | [Optional] The closing marker of the enclosure for variable substitution. It overrides the opening marker specified in the variable_substitution parameter of the arguments. | String |
| .config.context.filters | [Optional] A list of node paths to extract from the context data for use. The filters are applied before the default parameters are applied. | List |
| .config.context.default | [Optional] Default parameters to use when not present in the context data. | Dict |
| .config.context.remove-null.entries-only | [Optional] Set to True to remove only dictionary entries; set to false to remove both dictionary entries and null values in lists (Default = true). | Boolean |
| .config.context.remove-null.paths | [Optional] A list of node paths to remove dictionary entries or values from the context data before applying default parameters. | List |
| .config.alert.filters | [Optional] A list of node paths to extract from the alert for use. alert. prefix is not required. The filters are applied before the default parameters are applied. | List |
| .config.alert.default | [Optional] Default parameters to use when not present in the alert. | Dict |
| .config.alert.remove-null.entries-only | [Optional] Set to True to remove only dictionary entries; set to false to remove both dictionary entries and null values in lists (Default = true). | Boolean |
| .config.alert.remove-null.paths | [Optional] A list of node paths to remove dictionary entries or values from the alert before applying default parameters. | List |
| .config.issue.filters | [Optional] A list of node paths to extract from the issue for use. issue. prefix is not required. The filters are applied before the default parameters are applied. | List |
| .config.issue.default | [Optional] Default parameters to use when not present in the issue. | Dict |
| .config.issue.remove-null.entries-only | [Optional] Set to True to remove only dictionary entries; set to false to remove both dictionary entries and null values in lists (Default = true). | Boolean |
| .config.issue.remove-null.paths | [Optional] A list of node paths to remove dictionary entries or values from the issue before applying default parameters. | List |
| .config.incident.filters | [Optional] A list of node paths to extract from the incident for use. incident. prefix is not required. The filters are applied before the default parameters are applied. | List |
| .config.incident.default | [Optional] Default parameters to use when not present in the incident. | Dict |
| .config.incident.remove-null.entries-only | [Optional] Set to True to remove only dictionary entries; set to false to remove both dictionary entries and null values in lists (Default = true). | Boolean |
| .config.incident.remove-null.paths | [Optional] A list of node paths to remove dictionary entries or values from the incident before applying default parameters. | List |
Below is a sample of the config node.
.filters, .remove-null, and .default settings under content, alert, issue, and incident can help minimize the data used for Variable Substitution and provide default values.
Using Variable Substitution to pass the entire data to variables like ${.=val.username} is time-consuming. By using these settings to minimize the data and define default values, you can reduce the need to pass the entire data, thereby improving processing performance.
Node: query#
| Path | Description | Type |
|---|---|---|
| .query.xql | The XQL query string to retrieve the record set to create an entry. | String |
| .query.command.using | [Optional] The name of the integration instance to execute the XQL query command. It overrides xql_query_instance in the argument parameters. | String |
| .query.time_range.earliest_time | [Optional] The earliest time at which the time range of the query starts. It overrides earliest_time in the argument parameters. | String or Number |
| .query.time_range.latest_time | [Optional] The latest time at which the time range of the query ends. It overrides latest_time in the argument parameters. | String or Number |
| .query.time_range.round_time | [Optional] The value (in seconds) used to round down the base time. If the value is of type dict, .query.time_range.round_time.earliest_time and .query.time_range.round_time.latest_time can be provided. This parameter overrides round_time in the argument parameters. | String, Number or Dict |
| .query.time_range.round_time.earliest_time | [Optional] The value (in seconds) used to round down the base time for earliest_time. | String or Number |
| .query.time_range.round_time.latest_time | [Optional] The value (in seconds) used to round down the base time for latest_time. | String or Number |
| .query.conditions | [Optional] Conditions for executing XQL: it will only be executed if the conditions evaluate to true or are not specified. If the conditions evaluate to false, the .entry.default will be applied if it is specified and the conditions defined for it are satisfied, otherwise, an empty record set will be returned. | Any |
| .query.locking.module | [Optional] The locking module to use. Must be either core-lock or demisto-lock (Default = core-lock). | String |
| .query.locking.name | [Optional] The lock name passed as the name parameter to the core-lock-get command. | String |
| .query.locking.info | [Optional] Additional information provided for the lock instance via the info parameter of the core-lock-get command. | String |
| .query.locking.timeout | [Optional] The timeout value (in seconds) passed to the timeout parameter of the core-lock-get command. | String or Number |
| .query.locking.using | [Optional] The name of the Core Lock integration instance to execute the core-lock-get and core-lock-release. | String |
This node supports Variable Substitution for all parameters.
Node: .query.conditions#
The .query.conditions are evaluated as either true or false. The values of the conditions can be of any type in JSON (null, boolean, number, string, list, or dictionary).
null, false (of type boolean or string), 0 (of type number), and an empty string (i.e., a string with 0 length) will be treated as false. All other values will be treated as true for primitive data types.
A list or dictionary can represent a logical expression.
A list represents an
ORcondition, where each element in the list is treated as a separate condition. For example, the list[X, Y, Z]is evaluated asX OR Y OR Z. If any of the elements are true, the entire expression is considered true. If the list is empty, it is treated as false.A dictionary represents a logical expression combining
ANDandORconditions. Each key-value pair in the dictionary is treated as anANDcondition. The dictionary as a whole is evaluated as a combination of theseANDconditions, connected byOR. For example, consider the following dictionary:
This dictionary is evaluated as (Condition-A AND Condition-B) OR (Condition-X AND Condition-Y).
If any of the individual AND conditions evaluate to true, the entire dictionary expression will be true.
If the dictionary is empty, it is treated as false.
In addition, a dictionary can be nested. For example, consider the following dictionary:
This dictionary is evaluated as Condition-A AND Condition-B AND (Condition-X OR Condition-Y).
Node: entry#
| Path | Description | Type |
|---|---|---|
| .entry.type | The name of the entry type, which must be one of the following: markdown, markdown-table, number, number-trend, pie, line, single-bar, stacked-bar or duration. | String |
| .entry.markdown | [Entry-dependent parameters] This node is required only when markdown is set in .entry.type. | Dict |
| .entry.markdown-table | [Entry-dependent parameters] This node is required only when markdown-table is set in .entry.type. | Dict |
| .entry.number | [Entry-dependent parameters] This node is required only when number is set in .entry.type. | Dict |
| .entry.number-trend | [Entry-dependent parameters] This node is required only when number-trend is set in .entry.type. | Dict |
| .entry.pie | [Entry-dependent parameters] This node is required only when pie is set in .entry.type. | Dict |
| .entry.line | [Entry-dependent parameters] This node is required only when line is set in .entry.type. | Dict |
| .entry.single-bar | [Entry-dependent parameters] This node is required only when single-bar is set in .entry.type. | Dict |
| .entry.stacked-bar | [Entry-dependent parameters] This node is required only when stacked-bar is set in .entry.type. | Dict |
| .entry.duration | [Entry-dependent parameters] This node is required only when duration is set in .entry.type. | Dict |
| .entry.default | [Optional] The default entry settings. | Dict |
The .entry.type specifies the type of the entry, as shown below.
| Entry Type | Entry | Image |
|---|---|---|
| markdown | Markdown |  |
| markdown-table | Markdown Table | 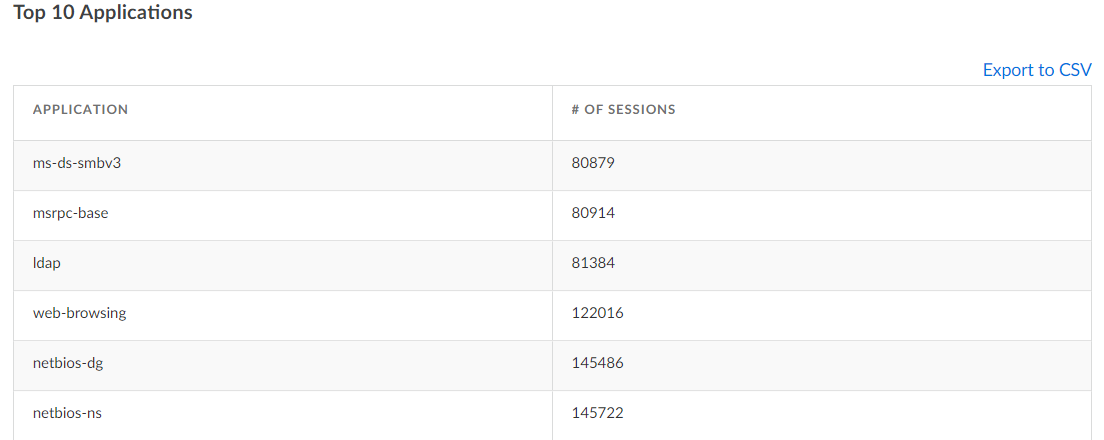 |
| number | Number |  |
| number-trend | Number Trend |  |
| pie | Pie Chart | 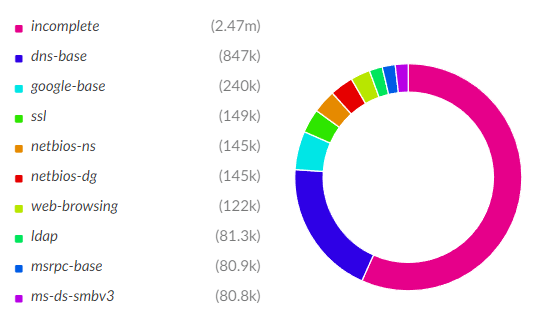 |
| line | Line Chart | 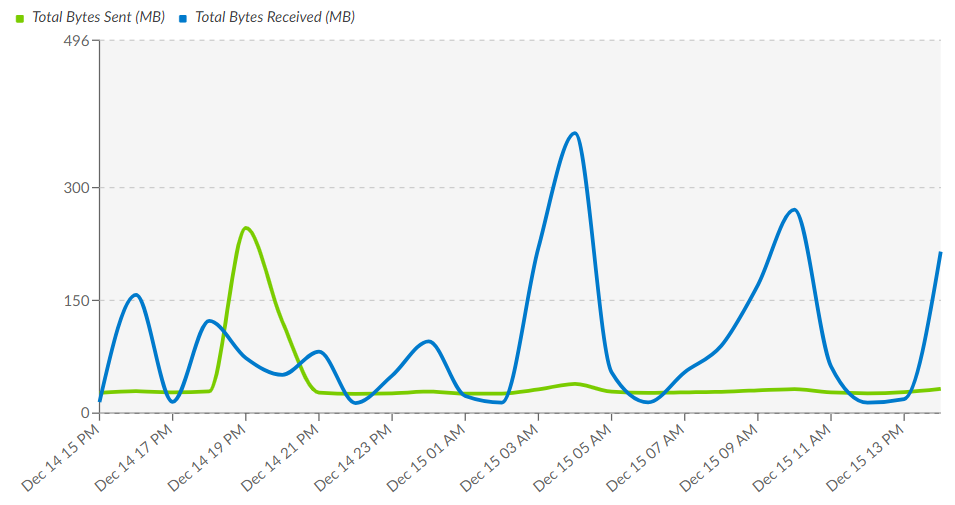 |
| single-bar | Single-Bar Chart | 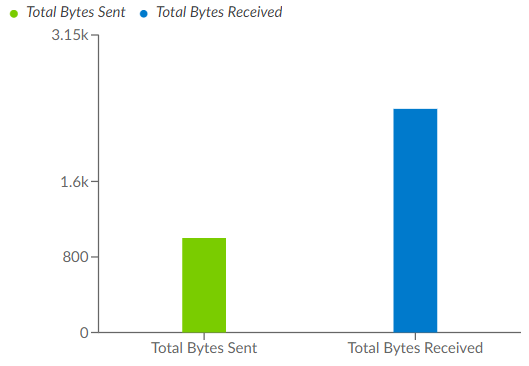 |
| stacked-bar | Stacked-Bar Chart | 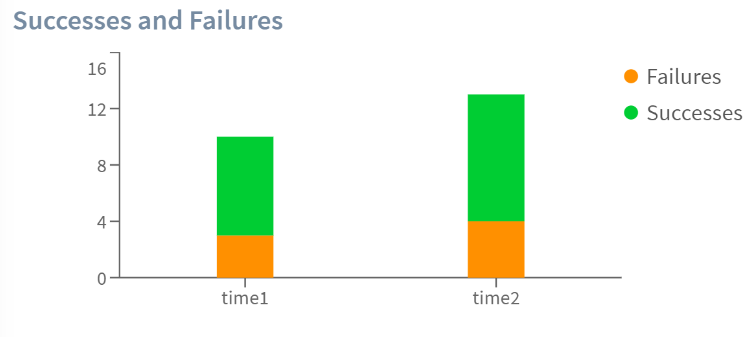 |
| duration | Time duration | 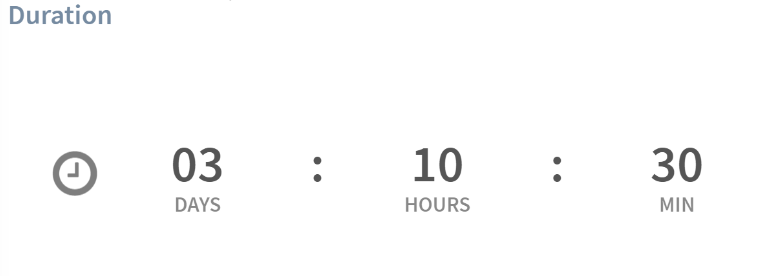 |
This node supports Variable Substitution for all parameters.
Node: entry.markdown#
| Path | Description | Type |
|---|---|---|
| .text | The markdown text to display. | String |
A sample structure of markdown in an entry node is shown below.
Node: entry.markdown-table#
| Path | Description | Type |
|---|---|---|
| .title | [Optional] The title of the markdown table. | String |
| .sort.by | [Optional] The name of the field by which to sort the record set. | String |
| .sort.order | [Optional] The sort order. Specifies either asc (default) for ascending or desc for descending. | String |
| .columns | [Optional] A list of table columns in the specified order. If not specified, all fields in the record set are displayed in the table. | List |
| .columns.field | [Optional] The name of the field used to display the field value. | String |
| .columns.label | [Optional] The label for the column. If not specified, the field name is used as the label. | String |
A sample structure of markdown-table in an entry node is shown below.
That is intended to create a table of the top 10 applications from the record set, as shown below, retrieved by the XQL query.
| app | count |
|---|---|
| netbios-dg | 145486 |
| msrpc-base | 80914 |
| web-browsing | 122016 |
| incomplete | 2479222 |
| ldap | 81384 |
| dns-base | 847200 |
| netbios-ns | 145722 |
| ms-ds-smbv3 | 80879 |
| ssl | 149358 |
| google-base | 240229 |
The table will be created as shown below:
Top 10 Applications
| Application | # of sessions |
|---|---|
| ms-ds-smbv3 | 80879 |
| msrpc-base | 80914 |
| ldap | 81384 |
| web-browsing | 122016 |
| netbios-dg | 145486 |
| netbios-ns | 145722 |
| ssl | 149358 |
| google-base | 240229 |
| dns-base | 847200 |
| incomplete | 2479222 |
Node: entry.number#
| Path | Description | Type |
|---|---|---|
| .field | The name of the field used to display the field value. | String |
| .params | [Optional] The parameters provided to Contents.params in the widget entry. | Dict |
The structure of a number widget entry is shown below for the General Purpose Dynamic Section.
The .params is passed to Contents.params.
For more details, refer to the Cortex XSIAM/XSOAR admin guide.
A sample structure of number in an entry node is shown below.
That is intended to create a number widget from the record set, as shown below, retrieved by the XQL query.
| n |
|---|
| 1234 |
The widget will be displayed as shown below.
The record set must contain at most one record for the number widget entry. An error is raised if it contains more than one record.
Node: entry.number-trend#
| Path | Description | Type |
|---|---|---|
| .prev-field | The name of the field used to track the value before the change or update. | String |
| .curr-field | The name of the field that represents the current value after the change or update. | String |
| .params | [Optional] The parameters provided to Contents.params in the widget entry. | Dict |
number-trend is a variation of the number widget entry, and will create the structure shown below for the General Purpose Dynamic Section.
The .params is passed to Contents.params.
For more details, refer to the Cortex XSIAM/XSOAR admin guide.
A sample structure of number-trend in an entry node is shown below.
That is intended to create a number-trend widget from the record set, as shown below, retrieved by the XQL query.
| last_n | curr_n |
|---|---|
| 1000 | 2000 |
The widget will be displayed as shown below.
The record set must contain at most one record for the number-trend widget entry. An error is raised if it contains more than one record.
Node: entry.pie#
| Path | Description | Type |
|---|---|---|
| .group | Specifies records or fields. The details will be provided later in this section. | String |
| .records | [Group-dependent parameters] This node is required only when records is set in .group. | Dict |
| .fields | [Group-dependent parameters] This node is required only when fields is set in .group. | Dict |
| .params | [Optional] The parameters provided to Contents.params in the widget entry. | Dict |
.group
When specifying records for .group, it indicates that each record represents a slice in the pie chart, with the corresponding legend label.
For example, given the following data:
| app | count |
|---|---|
| dns-base | 847200 |
| ssl | 149358 |
| netbios-dg | 145486 |
| ms-ds-smbv3 | 80879 |
| google-base | 240229 |
| incomplete | 2479222 |
| web-browsing | 122016 |
| ldap | 81384 |
| msrpc-base | 80914 |
| netbios-ns | 145722 |
The count values are displayed on the slices, with each corresponding app (e.g., dns-base, ssl, netbios-dg) shown as a legend label.
In this case, the settings must be configured under the .records node, as shown below:
| Path | Description | Type |
|---|---|---|
| .records.name-field | The name of the field used to display the legend labels for each slice in the pie chart. | String |
| .records.data-field | The name of the field that represents the summed value for each slice. | String |
| .records.colors | [Optional] The color configuration for each slice. For more details, see .colors. | List, Dict, or String |
| .records.sort.by | [Optional] The name of the field by which to sort the record set. If not specified, the value of .records.data-field will be used by default. | String |
| .records.sort.order | [Optional] The sort order. Specifies either asc (default) for ascending or desc for descending. | String |
Below is a sample XQL query and the corresponding records structure in the entry node.
This is a sample pie chart created using those settings.
When specifying fields for .group, it indicates that each field's value is represented as a separate slice in the pie chart.
In this case, the values for each field are displayed individually, and each field is associated with its own distinct legend label.
For example, given the following data:
| total_bytes_sent | total_bytes_received |
|---|---|
| 1023405 | 5050643 |
The total_bytes_sent and total_bytes_received fields will each be displayed as separate slices in the pie chart.
Each slice will be labeled accordingly, with the legend reflecting the field names, such as total_bytes_sent and total_bytes_received.
In this case, the settings must be configured under the .fields node, as shown below:
| Path | Description | Type |
|---|---|---|
| .fields | A dictionary that defines the fields used for the pie chart slices, where each key represents a field name. | Dict |
| .fields.<field-name>.label | [Optional] The label to be displayed in the legend for the slices. If not specified, the field name will be used as the label. | String |
| .fields.<field-name>.color | [Optional][Optional] The color palette for the slices. If not specified, the default color will be applied. | String |
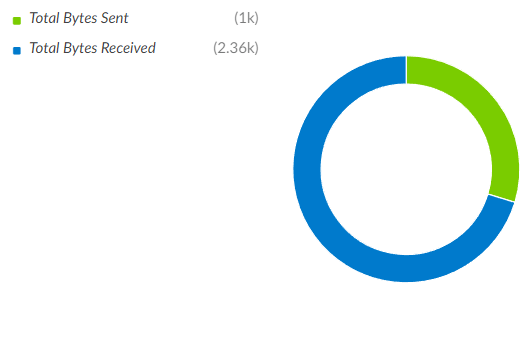
Below is a sample XQL query and the corresponding fields structure in the entry node.
Each key defined in the .fields is plotted as a separate slice in the pie chart, in the order they are specified.
For example, in the above configuration, total_bytes_sent_mb will be displayed as the first slice, and total_bytes_received_mb will be displayed as the second slice.
This is a sample pie chart created using those settings.
.params
The structure of a pie widget entry is shown below for the General Purpose Dynamic Section.
The .params is passed to Contents.params.
For more details, refer to the Cortex XSIAM/XSOAR admin guide.
Tips: Sorting Fields by Value in .group = "fields"#
When specifying fields for .group, each slice is plotted in the order defined in .fields.
This sample XQL query and the corresponding settings for the pie entry.
In this case, total_bytes_sent_mb will be displayed as the first slice, and total_bytes_received_mb will be displayed as the second slice.
If you want to plot each field ordered by total bytes, you need to use .group = records instead.
To achieve this, modify the XQL query as shown below:
This XQL query will return results similar to the following:
| name | value |
|---|---|
| Total Bytes Sent | 847200 |
| Total Bytes Received | 149358 |
To plot these fields ordered by total bytes, use .group = records with the following settings:
Node: entry.line#
| Path | Description | Type |
|---|---|---|
| .x.by | The name of the field by which values are aggregated into groups for the X-axis (e.g., time) of the line chart. | String |
| .x.sort-by | [Optional] The name of the field by which the X-axis values are sorted. If not specified, the .x.by field will be used by default. | String |
| .x.order | [Optional] The sort order of the values on the X-axis. Specifies either asc (default) for ascending or desc for descending. | String |
| .x.field | [Optional] The name of the field that represents the value displayed for each X-axis item. | String |
| .y.group | Specifies records or fields. The details will be provided later in this section. | String |
| .y.records | [Group-dependent parameters] This node is required only when records is set in .y.group. | Dict |
| .y.fields | [Group-dependent parameters] This node is required only when fields is set in .y.group. | Dict |
| .params | [Optional] The parameters provided to Contents.params in the widget entry. | Dict |
y.group
When specifying records for .y.group, it indicates that the values are aggregated and displayed on the Y-axis, with the corresponding legend labels for each item in the series.
For example, given the following data:
| time | app | count |
|---|---|---|
| 00:00 | dns-base | 847200 |
| 00:00 | ssl | 149358 |
| 00:00 | ldap | 46000 |
| 01:00 | dns-base | 742800 |
| 01:00 | ssl | 150386 |
| 01:00 | ldap | 95686 |
| 02:00 | dns-base | 8469141 |
| 02:00 | ssl | 156459 |
| 02:00 | ldap | 138657 |
The count values are displayed on the Y-axis, with each corresponding app (e.g., dns-base, ssl, ldap) appearing as a legend label.
In this case, the settings must be configured under the .y.records node, as shown below:
| Path | Description | Type |
|---|---|---|
| .y.records.name-field | The name of the field used to display the legend labels for each item in the series. | String |
| .y.records.data-field | The name of the field that represents the summed value plotted for each X-axis item. | String |
| .y.records.colors | [Optional] The color configuration for each item in the series. For more details, see .colors. | List, Dict or String |
Below is a sample XQL query and the corresponding records structure in the entry node.
This is a sample line chart created using those settings.
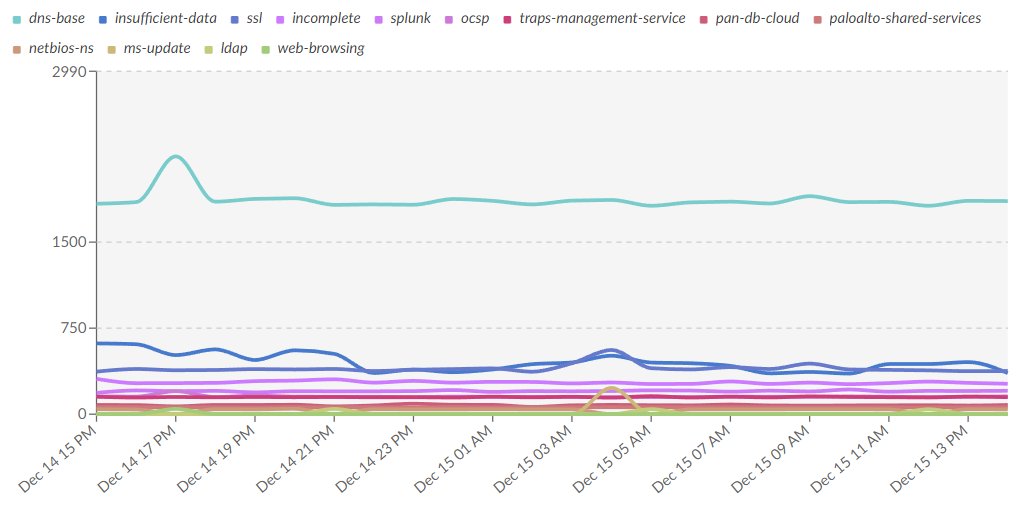
When specifying fields for .y.group, it indicates that the values for each field are displayed individually on the Y-axis.
In this case, each field's value is plotted as a separate series, with distinct legend labels for each field.
For example, given the following data:
| time | total_bytes_sent | total_bytes_received |
|---|---|---|
| 00:00 | 10234 | 50643 |
| 01:00 | 45011 | 68643 |
| 01:00 | 67633 | 345782 |
The total_bytes_sent and total_bytes_received fields are displayed as separate series on the Y-axis,
and each series will have its own legend label (e.g., total_bytes_sent and total_bytes_received).
In this case, the settings must be configured under the .y.fields node, as shown below:
| Path | Description | Type |
|---|---|---|
| .y.fields | A dictionary that defines the fields used for the line chart series, where each key represents a field name. | Dict |
| .y.fields.<field-name>.label | [Optional] The label to be displayed in the legend for the series. If not specified, the field name will be used as the label. | String |
| .y.fields.<field-name>.color | [Optional][Optional] The color palette for the series. If not specified, the default color will be applied. | String |
Below is a sample XQL query and the corresponding fields structure in the entry node.
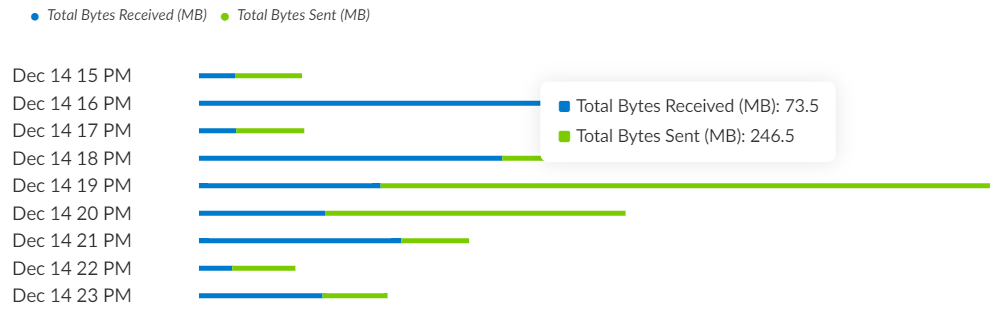
This is a sample line chart created using those settings.
.params
The structure of a line widget entry is shown below for the General Purpose Dynamic Section.
The .params is passed to Contents.params.
For more details, refer to the Cortex XSIAM/XSOAR admin guide.
Node: entry.single-bar#
| Path | Description | Type |
|---|---|---|
| .group | Specifies records or fields. The details will be provided later in this section. | String |
| .records | [Group-dependent parameters] This node is required only when records is set in .group. | Dict |
| .fields | [Group-dependent parameters] This node is required only when fields is set in .group. | Dict |
| .params | [Optional] The parameters provided to Contents.params in the widget entry. | Dict |
.group
When specifying records for .group, it indicates that each record represents a bar in the single-bar chart, with the corresponding legend label.
For example, given the following data:
| app | count |
|---|---|
| dns-base | 847200 |
| ssl | 149358 |
| netbios-dg | 145486 |
| ms-ds-smbv3 | 80879 |
| google-base | 240229 |
| incomplete | 2479222 |
| web-browsing | 122016 |
| ldap | 81384 |
| msrpc-base | 80914 |
| netbios-ns | 145722 |
The count values are displayed on the groups, with each corresponding app (e.g., dns-base, ssl, netbios-dg) shown as a legend label.
In this case, the settings must be configured under the .records node, as shown below:
| Path | Description | Type |
|---|---|---|
| .records.name-field | The name of the field used to display the legend labels for each bar in the single-bar chart. | String |
| .records.data-field | The name of the field that represents the summed value for each bar. | String |
| .records.colors | [Optional] The color configuration for each bar. For more details, see .colors. | List, Dict, or String |
| .records.sort.by | [Optional] The name of the field by which to sort the record set. If not specified, the value of .records.data-field will be used by default. | String |
| .records.sort.order | [Optional] The sort order. Specifies either asc (default) for ascending or desc for descending. | String |
Below is a sample XQL query and the corresponding records structure in the entry node.
This is a sample single-bar chart created using those settings.
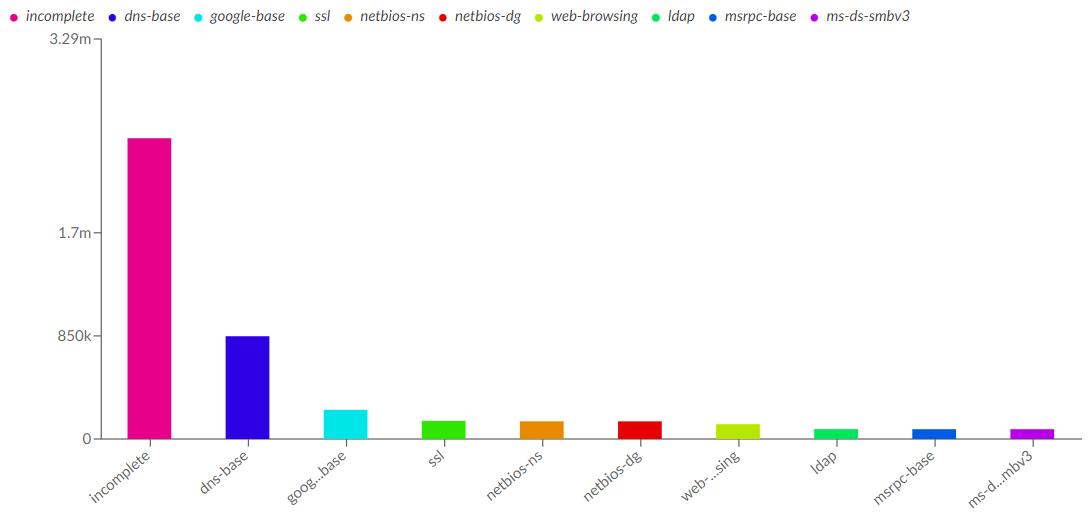
When specifying fields for .group, it indicates that each field's value is represented as a separate bar in the single-bar chart.
In this case, the values for each field are displayed individually, and each field is associated with its own distinct legend label.
For example, given the following data:
| total_bytes_sent | total_bytes_received |
|---|---|
| 1023405 | 5050643 |
The total_bytes_sent and total_bytes_received fields will each be displayed as separate bars in the single-bar chart.
Each slice will be labeled accordingly, with the legend reflecting the field names, such as total_bytes_sent and total_bytes_received.
In this case, the settings must be configured under the .fields node, as shown below:
| Path | Description | Type |
|---|---|---|
| .fields | A dictionary that defines the fields used for the single-bar chart groups, where each key represents a field name. | Dict |
| .fields.<field-name>.label | [Optional] The label to be displayed in the legend for the bars. If not specified, the field name will be used as the label. | String |
| .fields.<field-name>.color | [Optional][Optional] The color palette for the bars. If not specified, the default color will be applied. | String |
Below is a sample XQL query and the corresponding fields structure in the entry node.
Each key defined in the .fields is plotted as a separate bar in the single-bar chart, in the order they are specified.
For example, in the above configuration, total_bytes_sent_mb will be displayed as the first bar, and total_bytes_received_mb will be displayed as the second bar.
This is a sample single-bar chart created using those settings.
.params
single-bar is a variation of the bar widget entry, and will create the structure shown below for the General Purpose Dynamic Section.
The .params is passed to Contents.params.
For more details, refer to the Cortex XSIAM/XSOAR admin guide.
Tips: Sorting Fields by Value in .group = "fields"#
When specifying fields for .group, each bar is plotted in the order defined in .fields.
This sample XQL query and the corresponding settings for the single-bar entry.
In this case, total_bytes_sent_mb will be displayed as the first bar, and total_bytes_received_mb will be displayed as the second bar.
If you want to plot each field ordered by total bytes, you need to use .group = records instead.
To achieve this, modify the XQL query as shown below:
This XQL query will return results similar to the following:
| name | value |
|---|---|
| Total Bytes Sent | 847200 |
| Total Bytes Received | 149358 |
To plot these fields ordered by total bytes, use .group = records with the following settings:
Node: entry.stacked-bar#
| Path | Description | Type |
|---|---|---|
| .x.by | The name of the field by which values are aggregated into groups for the X-axis (e.g., time) of the stacked-bar chart. | String |
| .x.sort-by | [Optional] The name of the field by which the X-axis values are sorted. If not specified, the .x.by field will be used by default. | String |
| .x.order | [Optional] The sort order of the values on the X-axis. Specifies either asc (default) for ascending or desc for descending. | String |
| .x.field | [Optional] The name of the field that represents the value displayed for each X-axis item. | String |
| .y.group | Specifies records or fields. The details will be provided later in this section. | String |
| .y.records | [Group-dependent parameters] This node is required only when records is set in .y.group. | Dict |
| .y.fields | [Group-dependent parameters] This node is required only when fields is set in .y.group. | Dict |
| .params | [Optional] The parameters provided to Contents.params in the widget entry. | Dict |
y.group
When specifying records for .y.group, it indicates that the values are aggregated and displayed on the Y-axis, with the corresponding legend labels for each item in the groups.
For example, given the following data:
| time | app | count |
|---|---|---|
| 00:00 | dns-base | 847200 |
| 00:00 | ssl | 149358 |
| 00:00 | ldap | 46000 |
| 01:00 | dns-base | 742800 |
| 01:00 | ssl | 150386 |
| 01:00 | ldap | 95686 |
| 02:00 | dns-base | 8469141 |
| 02:00 | ssl | 156459 |
| 02:00 | ldap | 138657 |
The count values are displayed on the Y-axis, with each corresponding app (e.g., dns-base, ssl, ldap) appearing as a legend label.
In this case, the settings must be configured under the .y.records node, as shown below:
| Path | Description | Type |
|---|---|---|
| .y.records.name-field | The name of the field used to display the legend labels for each item in the groups. | String |
| .y.records.data-field | The name of the field that represents the summed value plotted for each X-axis item. | String |
| .y.records.colors | [Optional] The color configuration for each item in the groups. For more details, see .colors. | List, Dict, or String |
Below is a sample XQL query and the corresponding records structure in the entry node.
This is a sample stacked-bar chart created using those settings.
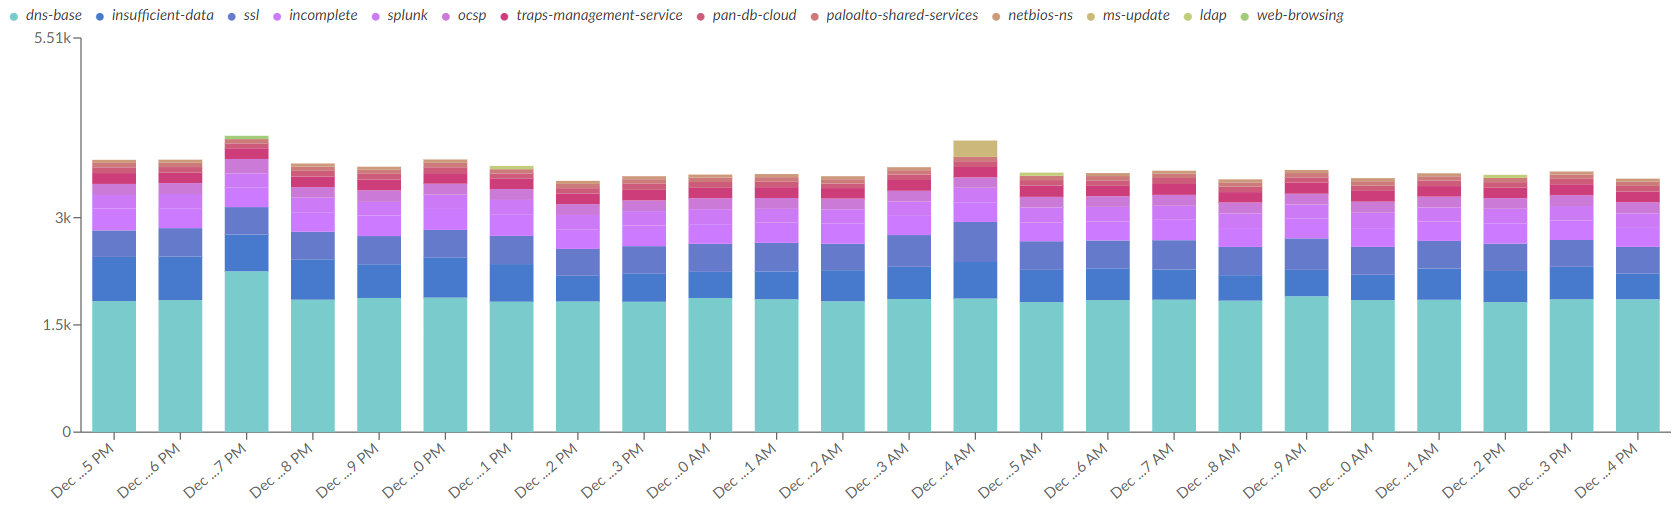
When specifying fields for .y.group, it indicates that the values for each field are displayed individually on the Y-axis.
In this case, each field's value is plotted as a separate group, with distinct legend labels for each field.
For example, given the following data:
| time | total_bytes_sent | total_bytes_received |
|---|---|---|
| 00:00 | 10234 | 50643 |
| 01:00 | 45011 | 68643 |
| 01:00 | 67633 | 345782 |
The total_bytes_sent and total_bytes_received fields are displayed as separate groups on the Y-axis,
and each groups will have its own legend label (e.g., total_bytes_sent and total_bytes_received).
In this case, the settings must be configured under the .y.fields node, as shown below:
| Path | Description | Type |
|---|---|---|
| .y.fields | A dictionary that defines the fields used for the line chart groups, where each key represents a field name. | Dict |
| .y.fields.<field-name>.label | [Optional] The label to be displayed in the legend for the groups. If not specified, the field name will be used as the label. | String |
| .y.fields.<field-name>.color | [Optional][Optional] The color palette for the groups. If not specified, the default color will be applied. | String |
Below is a sample XQL query and the corresponding fields structure in the entry node.
This is a sample stacked-bar chart created using those settings.
.params
stacked-bar is a variation of the bar widget entry, and will create the structure shown below for the General Purpose Dynamic Section.
The .params is passed to Contents.params.
For more details, refer to the Cortex XSIAM/XSOAR admin guide.
Node: entry.duration#
| Path | Description | Type |
|---|---|---|
| .field | The name of the field whose value specifies the duration, and the value must be in seconds. | String |
| .params | [Optional] The parameters provided to Contents.params in the widget entry. | Dict |
The structure of a duration widget entry is shown below for the General Purpose Dynamic Section.
The .params is passed to Contents.params.
For more details, refer to the Cortex XSIAM/XSOAR admin guide.
A sample structure of duration in an entry node is shown below.
That is intended to create a number widget from the record set, as shown below, retrieved by the XQL query.
| _duration |
|---|
| 86340 |
The widget will be displayed as shown below.
The record set must contain at most one record for the duration widget entry. An error is raised if it contains more than one record.
Node: entry.default#
| Path | Description | Type |
|---|---|---|
| .scope | [Optional] A list of scope. The possible values are no_recordset and query_skipped, which indicate when no record set is available or when a query is skipped, respectively (Default = ["no_recordset", "query_skipped"]). | String or List |
| .entry | [Optional] The default entry that is returned when the conditions specified in .scope are met, and no specific default entries are available. | String or Dict |
| .no_recordset | [Optional] The default entry returned when no_recordset is given to .scope, and the specified conditions are met. | String or Dict |
| .query_skipped | [Optional] The default entry returned when query_skipped is given to .scope, and the specified conditions are met. | String or Dict |
The default entry is a fallback value. Instead of creating an entry from the query results, it is used to display a message indicating that the query was not executed or that no record set is available. It will be applied if either of the following conditions is met:
query_skippedis included in the.scope, and the.query.conditionsin thequerynode evaluates to false.no_recordsetis included in the.scope, and no record set is returned by the XQL query.
The .no_recordset, .query_skipped and .entry must be of type str or dict.
If it is of type str, it represents markdown text to be displayed as an entry, as shown below:
If it is of type dict, the value is returned as-is.
Common Node: .colors#
The colors node configures color palettes for each slice, series, or group in the graph chart.
The value can be of type str, dict, or list.
.colors (str) - specified color#
When the value is of type str, it specifies the color applied to all items (slice, series, or group).
.colors (dict) - color mapping#
When the value is of type dict, it represents the color mapping.
Each key in the dictionary corresponds to a specific category or group (a slice, series, or group) in the chart,
and the associated value is the color that will be applied to that category.
For example, in the provided configuration:
The category dns-base will be colored rgb(0, 144, 255), incomplete will be colored rgb(255, 144, 0), and ssl will be colored rgb(255, 0, 144).
If a category is not specified in the mapping, it will use the default color scheme.
.colors (list) - color order#
When the value is of type list, it represents an array of colors that will be applied sequentially to each item (slice, series, or group) in the chart.
The colors in the list are applied in the order they appear, starting with the first item in the chart.
If the number of items exceeds the number of colors in the list, the default color scheme will be applied.
For example, in the provided configuration:
The colors will be applied to the chart items in the following order: rgb(0, 144, 255) for the first item, rgb(20, 144, 255) for the second item, and so on.
If there are more than 11 items in the chart, the default color scheme will be applied for the remaining items.
Variable Substitution#
Variable Substitution is a syntax used to dynamically replace variables within a string. It enables the insertion of values from Lists, Context Data, Alert Context (Cortex XSIAM), Incident Context (Cortex XSOAR) or Extended Variables, into predefined templates.
By default, a variable is enclosed by ${ and }, and those symbols can be changed using the .config.variable_substitution in the template or the variable_substitution argument parameter.
e.g.
The syntax supports the DT expression, allowing you to make template text more flexible and customizable.
e.g.
Variables can be replaced by the standard Cortex XSIAM/XSOAR DT expression.
- ${<context-path>}
- ${lists.<list-name>}
- ${alert.<alert-field>}
- ${issue.<issue-field>}
- ${incident.<incident-field>}
In addition, it supports extended variables that start with ..
${.recordset}
- It refers to the record set retrieved by the XQL query.
${.query.string}
- It refers to the query string used in the XQL query.
${.query.timeframe.from}
- It refers to the start time of the time frame in ISO 8601 time format in UTC applied in the XQL query.
${.query.timeframe.to}
- It refers to the end time of the time frame in ISO 8601 time format in UTC applied in the XQL query
${.query.execution_id}
- It refers to the unique execution ID for the request query.
${.query.request_url}
- It refers to the URL path, including query parameters, used to search datasets in the XQL builder. (e.g., /xql/xql-search?phrase=dataset%3Dxdr_data&timeframe=%7B%22from%22%3A%201734190414000%2C%20%22to%22%3A%201734276814000%7D)
${.query.result_url}
- It refers to the URL path used to get the results of an executed query in the XQL builder. (e.g., /xql/xql-search/1234567890abcd_123456_inv)
Caching#
When caching is enabled, data is stored in the context data and retrieved from it to create the entry, preventing repeated execution of the same query with the same conditions in order to improve performance.
It is managed under the XQLDSHelperCache.<template-name> path within the context data.
Caching can be controlled by the cache_type argument parameter.
cache_type:
recordset- All the record sets retrieved from the query are stored in the cache. Entries will be correctly created even when only the parameters in the "entry" are modified, as they are rebuilt from the raw record sets in the cache, provided the query parameters remain unchanged.
cache_type:
entry- Only entry data is stored in the cache. The same entry is returned if the query parameters remain unchanged. This option helps minimize the cache data size. However, if only the parameters within the entry are modified (for example, if the 'colors' parameter is modified), the correct entry cannot be retrieved, as it does not re-query the record set to create a new entry with the updated settings.
Record Limit for Query Results#
XQL queries are executed using the xdr-xql-generic-query command, which is provided by the XQL Query Engine integration.
By default, the command returns up to 100 records. To retrieve more records, you need to add a limit stage to the XQL query.
Below is a sample XQL query that includes a limit stage:
Locking Queries#
In Cortex XSIAM and Cortex XDR, the number of concurrent XQL query executions via the REST API is limited to four.
Submitting more queries than this may lead to errors.
The script XQLDSHelper supports retry logic and can wait until execution becomes possible, but by holding onto an execution slot it might impact other playbooks running queries in parallel.
To prevent this, exclusive locking is supported via the Core Lock or Demisto Lock mechanism.
When .query.locking is enabled, XQLDSHelper acquires a lock during query execution and releases it afterward.
This ensures that multiple queries do not run concurrently and allows coordinated execution alongside other playbooks.
Backward Compatibility for Cortex XSIAM 2.x#
Due to naming policy updates, alert fields in Cortex XSIAM 2.x have been changed to issue fields in the Cortex Unified Platform.
Correspondingly, the namespace has also been updated from alert to issue.
For backward compatibility, the XQLDSHelper still allows you to reference issue fields using the alert namespace, as well as the new issue namespace.
Sample Content Bundle#
To assist you more effectively, we’ve provided sample automation scripts with List data, including template data and XQL query strings, in a content bundle. You can conveniently download them using the link below.
Once you've imported the bundle into your Cortex XSIAM or XSOAR instance, you will see lists starting with XQLDS_Sample_ in the Lists menu for template data and XQL queries, and automation scripts starting with XQLDS_Sample_ in the Scripts menu for displaying widgets in the General Purpose Dynamic Section.
XQLDS_Sample_Templates in the Lists is the main template used by the automation scripts. You can refer to it to deepen your understanding of the template structure.